
Dashlytics Statistical Report Gadget
The Dashlytics Statistical Report Gadget displays a saved Dashlytics report on a Jira dashboard. It has a configure form (for setup) and a view mode (for everyday use).
Configuring the gadget
Put the dashboard into edit mode with Edit, then choose Configure from the gadget's ⋯ menu.
Report
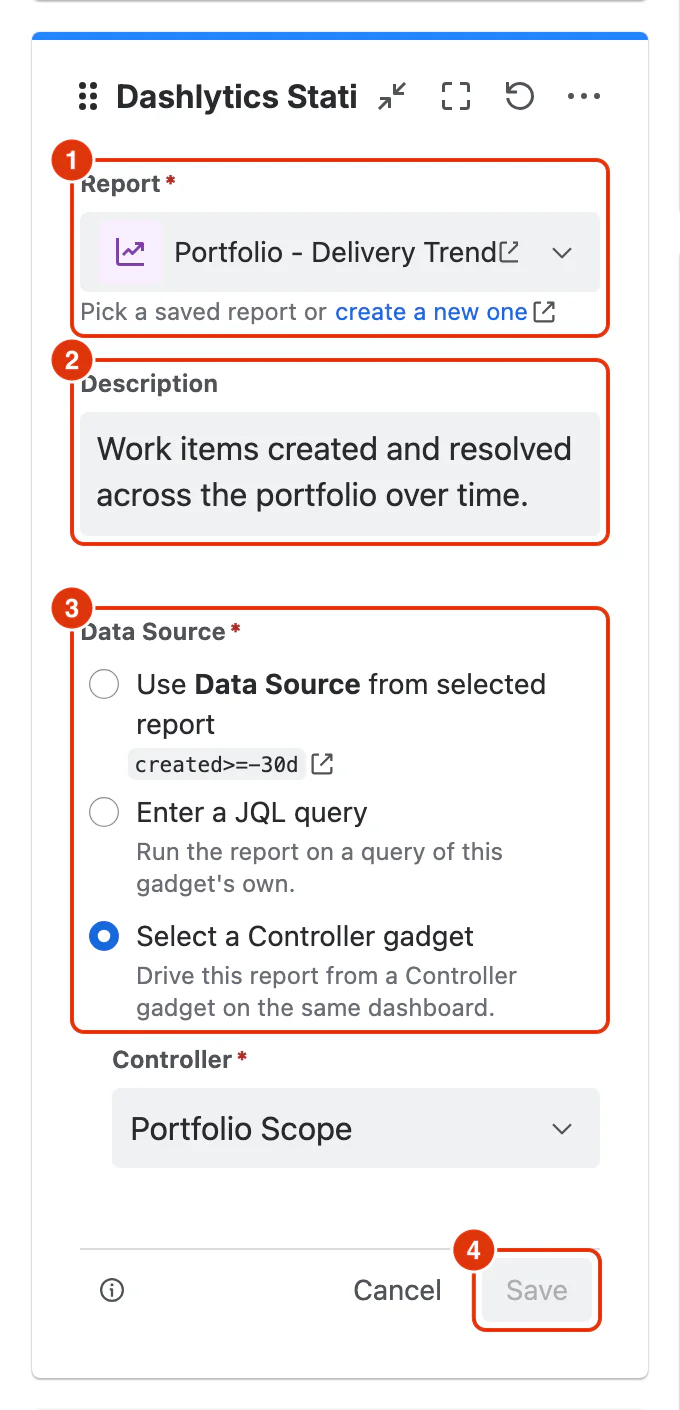
Report (required) (1) — the saved Dashlytics report this gadget displays. All saved reports are available, regardless of who created them. Create a new one opens the Report Builder in a new tab.
Description
Description (optional) (2) — a short note, up to 1000 characters, shown at the top of the gadget in view mode. It is filled in from the chosen report's description. Once you write your own, choosing a different report leaves your text as it is.
Data Source
Data Source (required) (3) — where the gadget gets its work items:
- Use Data Source from selected report — the gadget uses the JQL saved with the report itself, shown below the option. No Controller Gadget is needed. This is the simplest setup, and works well when each report on the dashboard has its own fixed scope.
- Enter a JQL query — runs the report on a JQL query of this gadget's own, entered in the field that appears below the option. Use it when one gadget needs a different scope from its report, without changing the saved report or adding a Controller.
- Select a Controller gadget — drives the report from a Dashlytics Controller Gadget on the same dashboard. Pick the Controller under Controller. The gadget then uses the Controller's JQL instead of the report's own, and refreshes whenever that JQL changes.
Click Save (4) to apply the setup, or Cancel to leave the gadget as it was. Leave dashboard edit mode with Done.
View mode
In view mode, the gadget displays the report in a read-only interactive format.
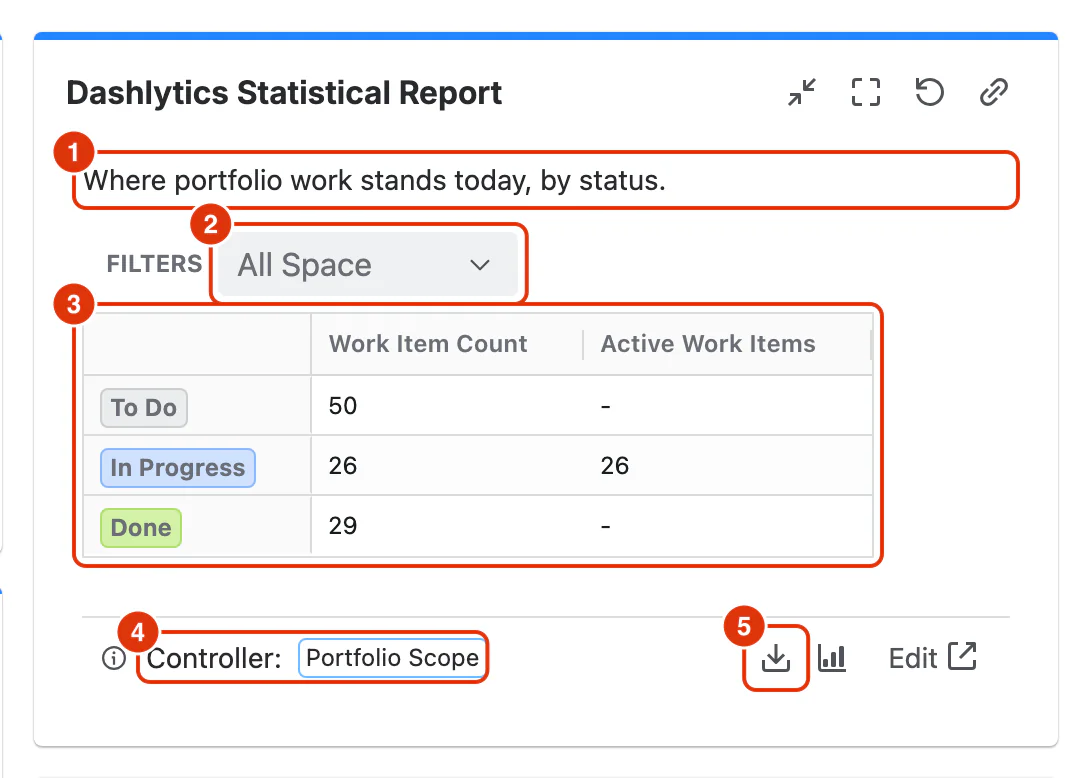
The title above the gadget is the one Jira shows for every gadget.
Description (1) — the description entered in the configure form, cut to two lines; point at it to read the rest. A gadget with no description shows the report straight away.
Filters (2) — one filter per dimension placed in the Filters zone of the report's Configure dialog. Changing a filter value narrows what this gadget shows and does not alter the saved report.
Report table (3) — the report data for the current filter selection.
Controller (4) — when the gadget is driven by a Controller, its name is shown here, so you can see which data source is active. Otherwise the footer shows the JQL the gadget runs on.
Download report (5) — exports the current report as CSV, Excel, or PDF. It stays greyed out until the gadget has finished fetching its data. See Exporting Reports. The icon beside it switches between the table and the chart view, and Edit opens the saved report in the Report Builder in a new tab.
Chart view
The gadget opens in the view format saved with the report. In the chart view, a selector lets you switch between Bar Chart, Line Chart, and Area Chart. The chart supports the same interactions as in the Report Builder — clickable legend, tooltips, scrolling, and dual axes.
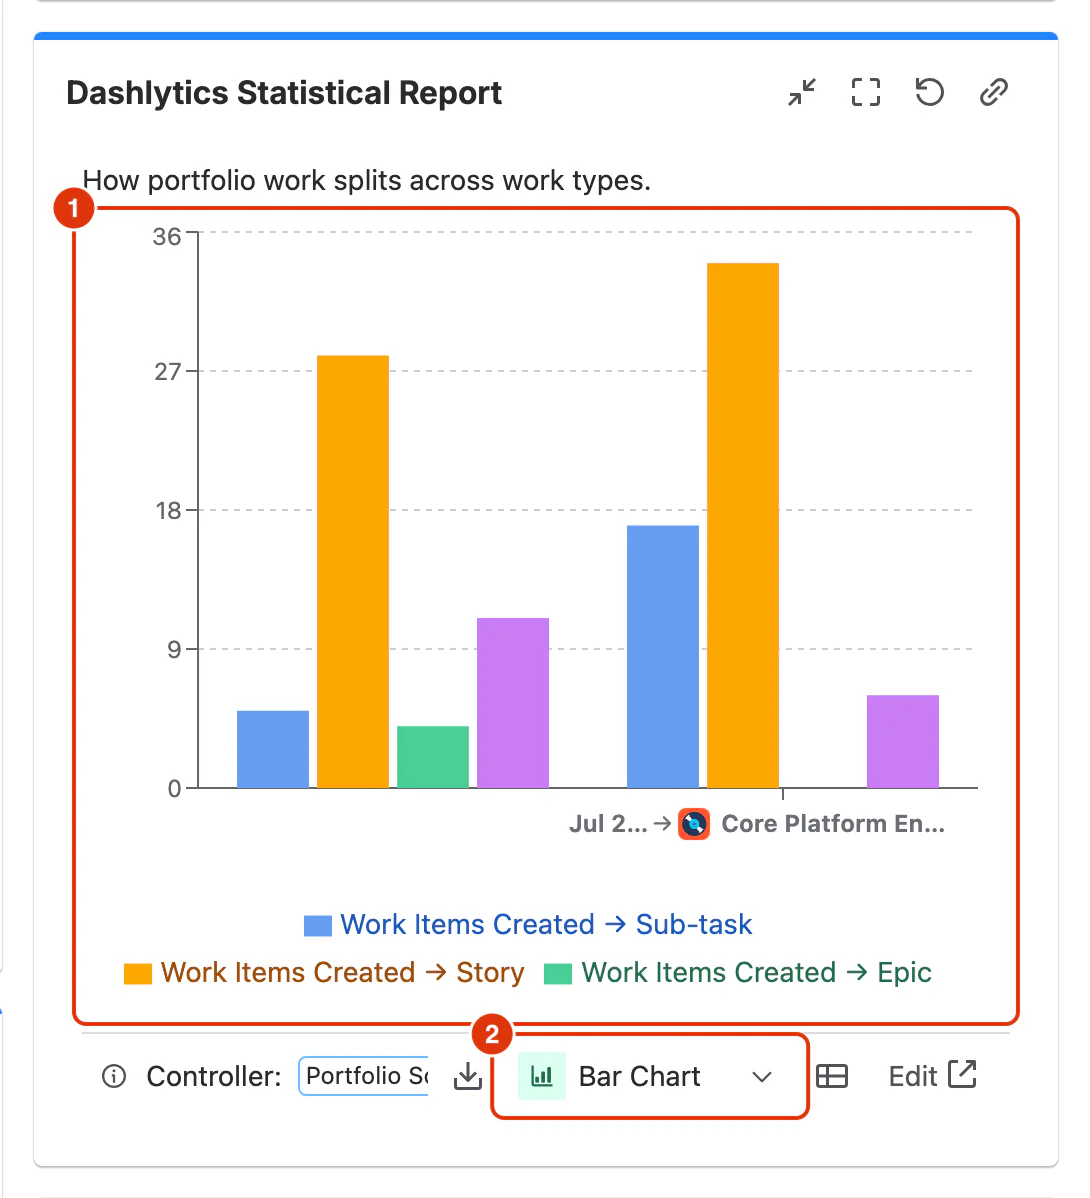
The chart (1) uses the report's Rows and Metrics, and the chart type selector (2) sits in the gadget's footer.
For a step-by-step guide to adding gadgets to a dashboard, see Using Dashboards in the Feature Guides section.