
Metric Configuration
The Metric Configuration panel opens when you click the ⚙ icon on a Metric in the Selected Metrics panel. It allows you to customise how that specific Metric instance calculates its values.
The configuration options shown depend on the Metric type. Each Metric exposes only the options relevant to its calculation.
Field options such as Time Grouping Field and Numeric Field group their fields into Jira Standard Fields, Custom Fields and App Fields. App Fields are calculated by Dashlytics — see App Fields.
Name and Description
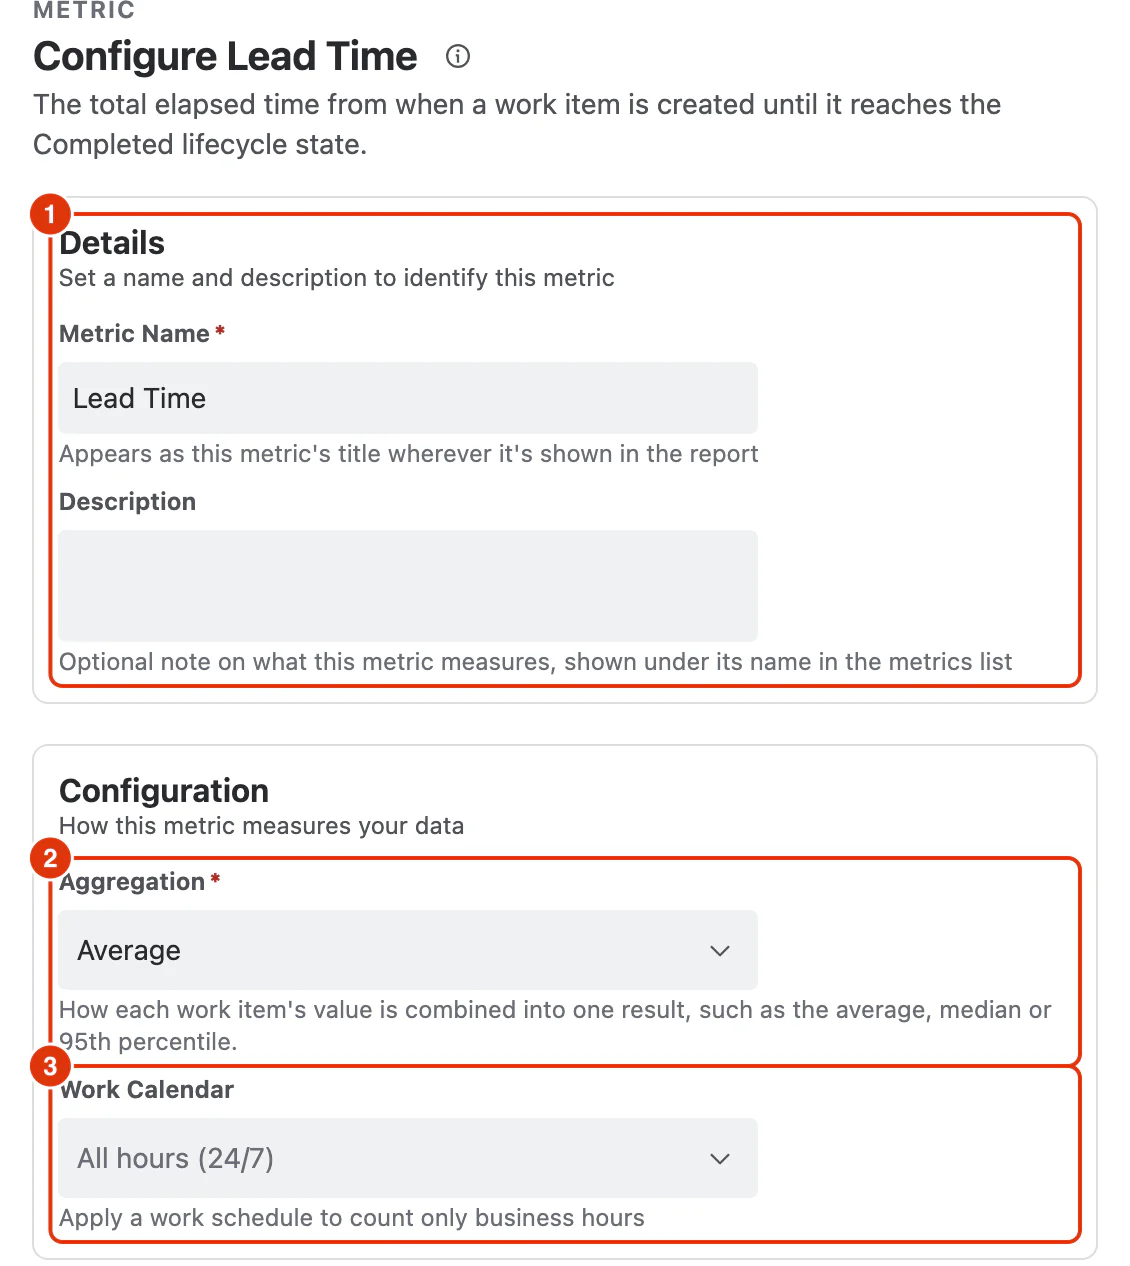
Each configured Metric instance has its own Metric Name and Description, under Details (1). Update them to explain the business meaning of that particular column in the report — especially when the same Metric is used more than once with different filters, fields, or calculation options.
These labels are saved with the report definition. This makes the report easier to understand when it is reopened or displayed in a dashboard, without changing the underlying Metric template.
Configuration
Aggregation (2) — how each work item's value is combined into one result, such as the average, median or 95th percentile.
Work Calendar (3) — on a duration Metric, the calendar whose working hours the duration is counted against. Leave it as All hours (24/7) to count elapsed time. See Work Calendar Setup.
The rest of the panel depends on the Metric. Once you have made your changes, click Apply to save the configuration for that Metric instance.
For details on individual Metrics and their specific configuration options, see Metrics in the Reference section.