
Status Category Transitions
Status Category Transitions measures how often work items move between Jira status categories (To Do, In Progress, Done) during a selected time period: the total number of transitions, or the average, median or 95th percentile per work item.
Each transition is treated as a discrete event and is counted at the moment the status category change occurs.
This Metric focuses on movement across major workflow phases, not detailed status steps, time spent, or effort logged.
What Question Does Status Category Transitions Answer?
Status Category Transitions is designed to answer:
How often does work move between major workflow phases?
How Status Category Transitions Is Calculated
Status Category Transitions is an event-based Metric. For each work item, each change in Jira status category generates a transition event. A transition is counted if its timestamp falls within the selected time period. Each transition is counted independently, even if the same work item transitions multiple times. This Metric operates directly on Jira status categories and does not use lifecycle mapping.
The transitions are counted for each work item, and the Aggregation option combines those counts into the value shown. By default this is the average number of transitions per work item; Sum shows the total number of transitions.
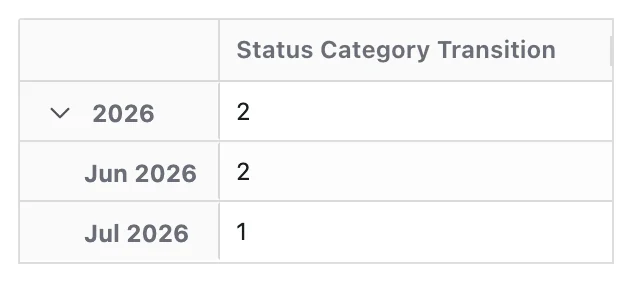
When a Time dimension is applied, each transition event is assigned to a single time period based on when it occurs. Multiple transitions from the same work item can be counted across different time periods. Time represents when movement occurs, not how long work spends in a phase.
Configuration
Status Category Transitions adds these options to the Metric Name and Description every Metric has:
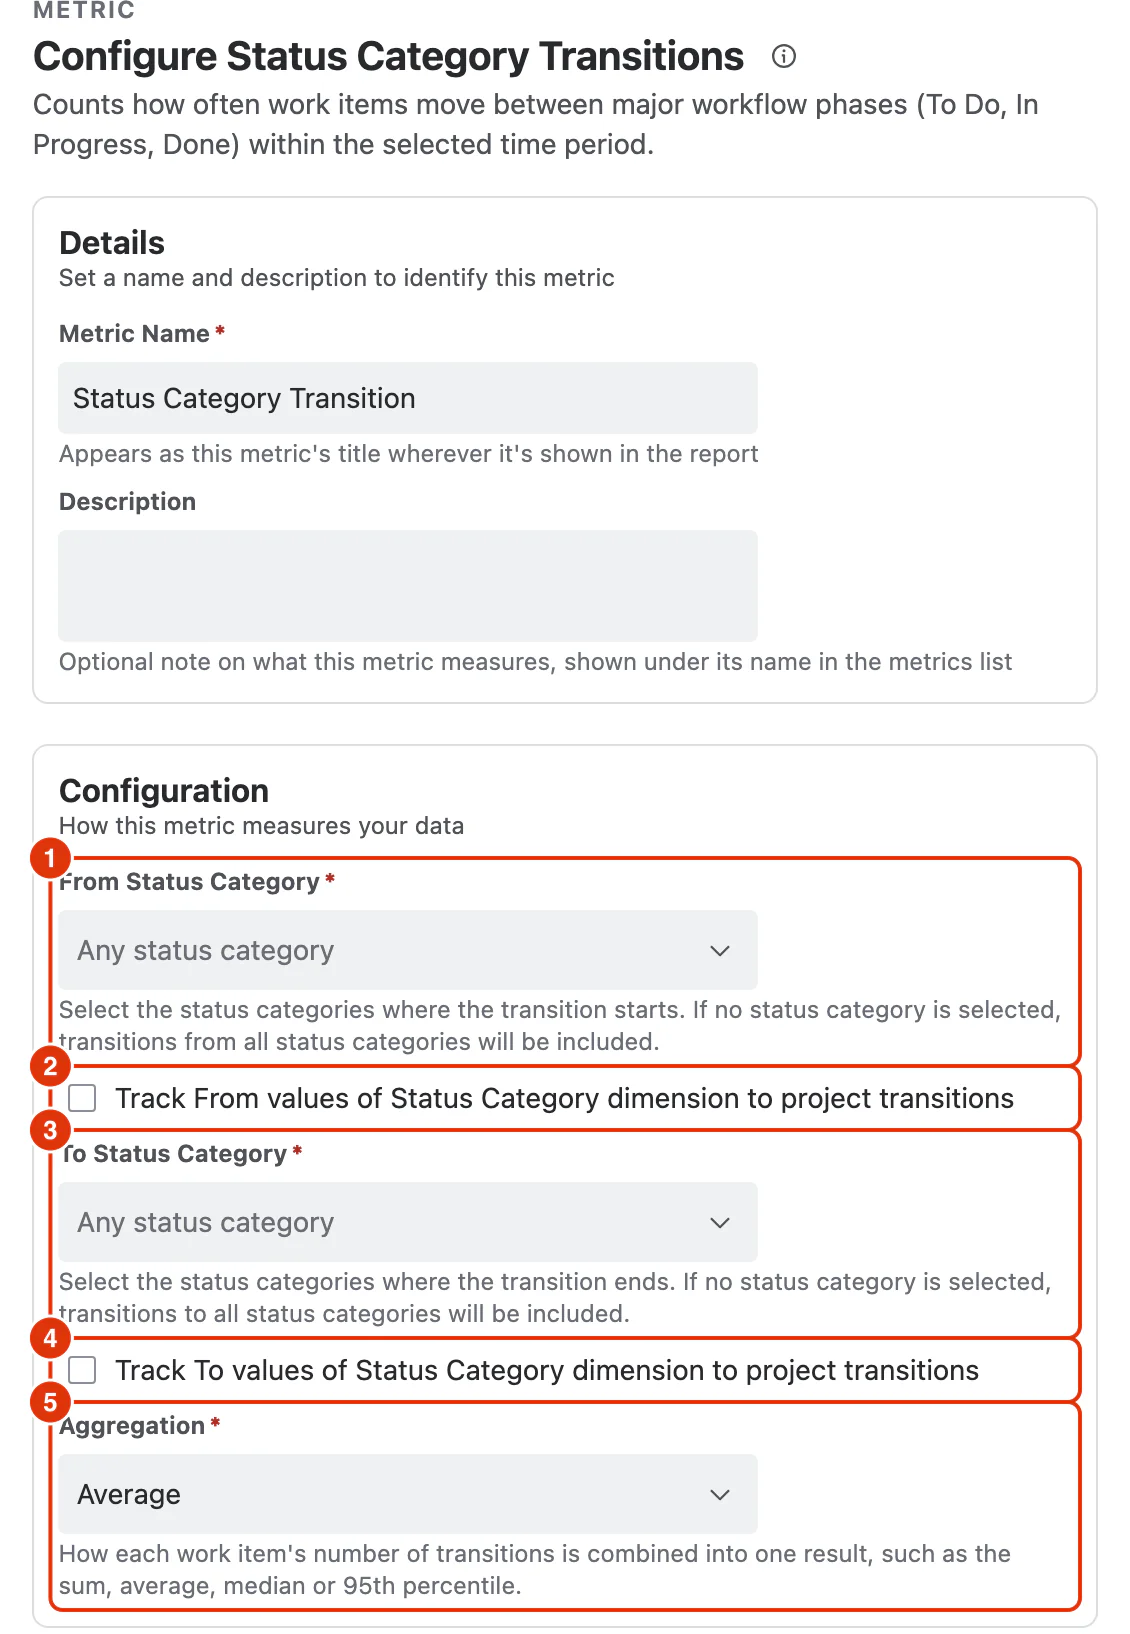
From Status Category (1)
The status categories a counted transition starts from. Leaving it empty includes transitions from any status category.
Track From values of Status Category dimension to project transitions (2)
Makes the report's Status Category dimension track the status category each transition started from. Every value of that dimension, whether it is in Filters, Rows or Columns, receives the transitions that left that status category.
To Status Category (3)
The status categories a counted transition ends at. Leaving it empty includes transitions to any status category.
Track To values of Status Category dimension to project transitions (4)
Makes the report's Status Category dimension track the status category each transition ended at. Every value of that dimension, whether it is in Filters, Rows or Columns, receives the transitions that arrived at that status category.
The two options cannot be selected together: selecting one disables the other. With neither selected, the Status Category dimension shows each work item's current status category.
Aggregation (5)
How each work item's number of matching transitions is combined into one result:
- Sum: the total number of transitions
- Average (default): the average number of transitions per work item
- Median
- Percentile (P95)
Average, Median and Percentile (P95) only include work items with at least one matching transition in the period. A work item that never made the transition is left out rather than counted as 0.
Note: If a status is deleted, any transition involving it is not counted towards a status category change.
What You Can Analyse with Status Category Transitions
Status Category Transitions is commonly used to analyse:
High-Level Flow
- How frequently work moves between major workflow phases
- Overall system movement and throughput signals
Start and Completion Signals
- How often work is started
- How often work reaches completion
Rework and Stability
- Frequency of reopens or regressions
- High-level quality and delivery stability indicators
Flow Trends
- Changes in start, completion, or reopen behaviour over time
- Impact of policy or process changes
Leadership Focus Areas
- Where flow breaks down at a macro level
- Which phase transitions need attention or simplification