
Time Dimension Configuration
The Time dimension's configuration panel opens when you click the Configure Dimension (⚙) icon on the Time dimension chip in the Layout Designer. It is headed Configure Time.
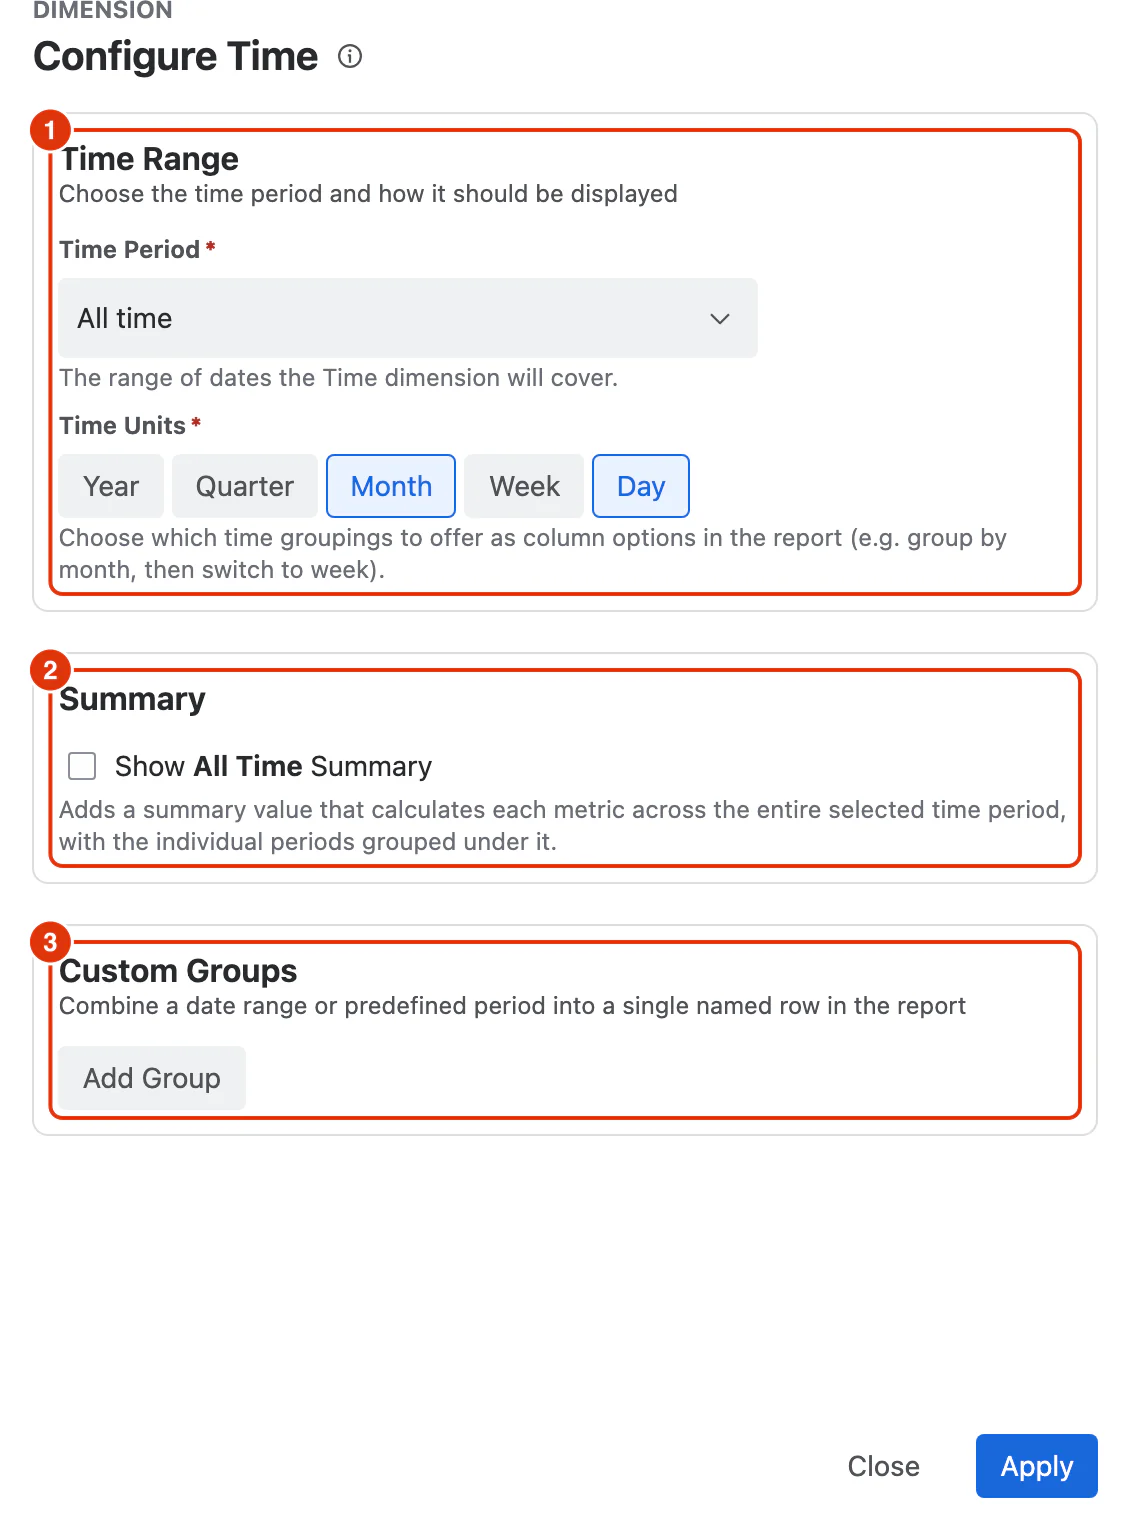
Time Range
The Time Range section holds the two required settings below.
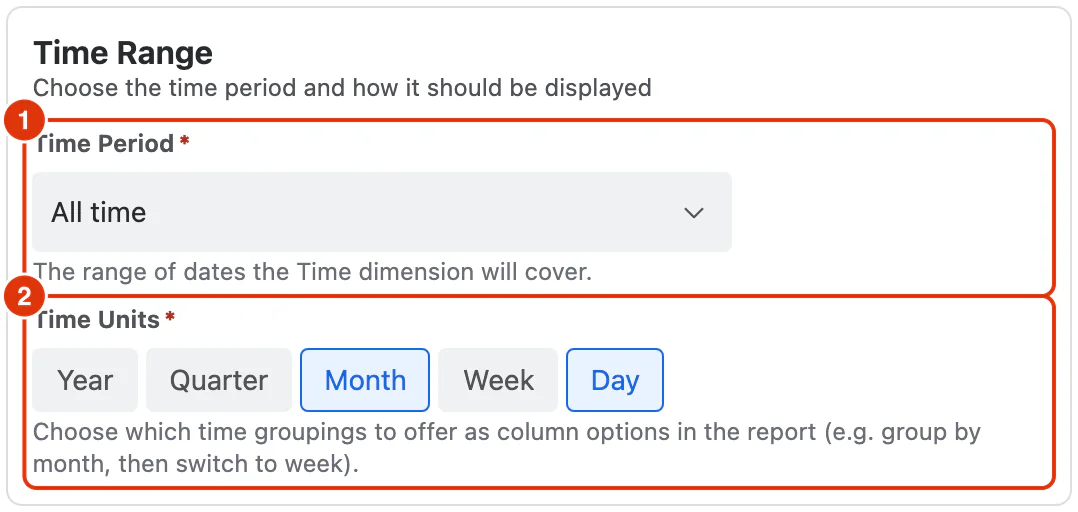
Time Period (1)
A dropdown that defines the date range of data included in the report.
Default: All
Options:
- All
- Today
- Yesterday
- Last 7 days
- Last 30 days
- Last 3 months
- Current week
- Last week
- Current month
- Last month
- Current quarter
- Last quarter
- Current year
- Last year
- Custom (enter a specific From and To date)
Time Units (required) (2)
Buttons that define the granularity at which data is grouped and displayed along the timeline. Multiple time units can be selected simultaneously.
Year is always present and cannot be deselected. It acts as the top-level grouping. Additional units can be selected to add finer levels of detail:
- Quarter
- Month
- Week
- Day
Summary
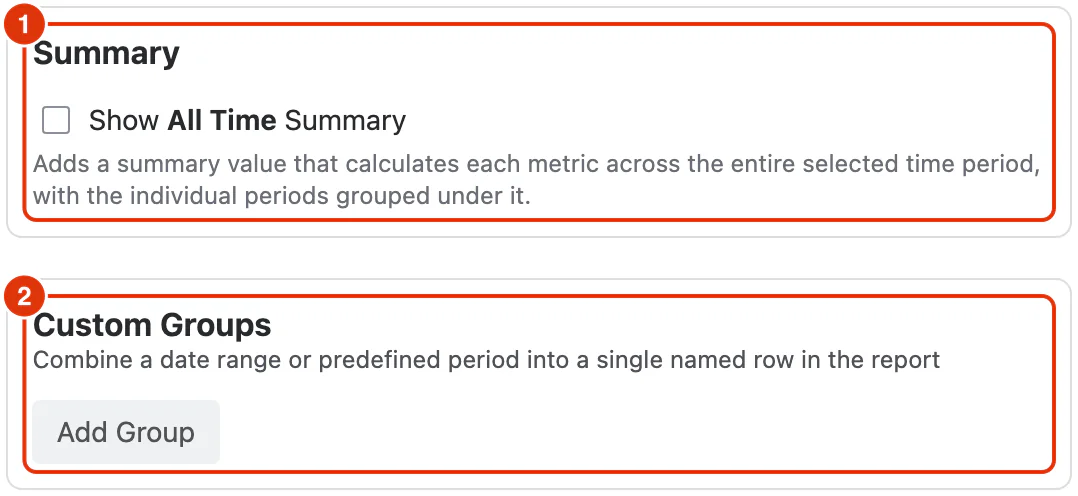
Show All Time Summary (1) — when checked, adds an All Time level to the report that groups all values and shows their aggregated value (e.g. sum or average). This gives users an overall total alongside the time-period breakdown.
Custom Groups
Custom Groups (2) combine a date range or predefined period into a single named row in the report. This is useful for comparing specific date ranges that don't align with standard time periods.
Click Add Group, then give the group:
Display name (required) — the label shown in the report for this group.
Time Period (required) — the date range the group covers.
Multiple groups can be created.
Actions
Apply — saves the configuration and closes the dialog.
Close — closes the dialog without saving any changes.
For guidance on using the Time dimension in reports, see Configuring a Report in the Feature Guides section.