
Quick Start Tutorial
Make sure your Jira Administrator has completed the initial app setup — in particular, Lifecycle Mapping — in App Configuration. These settings affect how Metrics calculate results across all reports. If you are not sure whether this has been done, check with your admin before proceeding.
This tutorial walks you through creating your first report in Dashlytics from start to finish. By the end you will have a saved report showing work item counts grouped by space.
The pattern you learn here applies to every report you build in Dashlytics: choose a data source, arrange dimensions to define how the data is sliced, add Metrics to define what is calculated, and save. Once you understand that pattern, you can apply it to any reporting question your team has.
Step 1: Select a Template from the Home Page
- Log into your Jira Cloud instance.
- In the left sidebar, click Apps → Dashlytics.
- On the Home screen, scroll to the Start from a template section. Use Search templates (1) to find one by name.
- Click Use template (2) on any template.
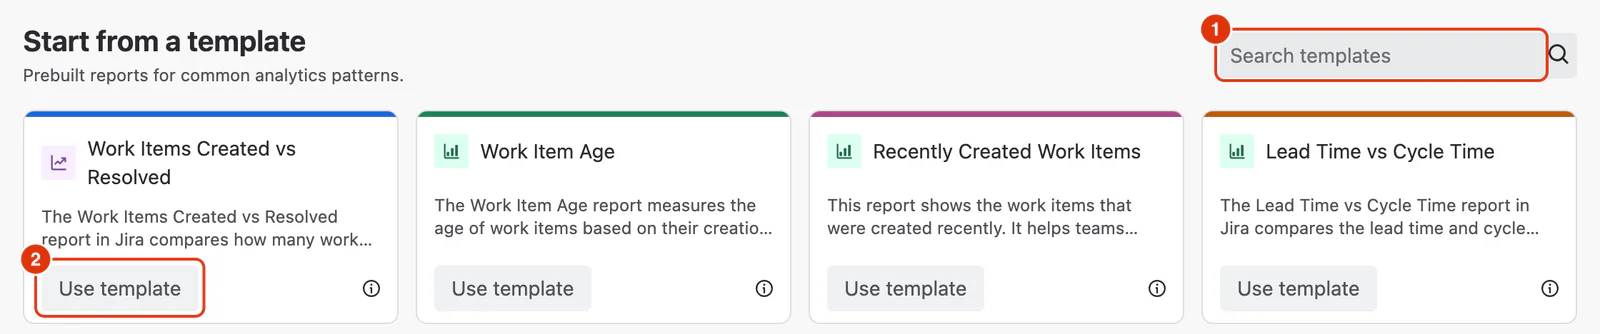
Using a template opens the Report Builder with the report pre-configured and ready to customise.
Step 2: Review or Update the Data Source
Each template already includes a pre-configured data source (JQL query). You can keep the existing query or modify it to match the spaces, work types, teams, or time range you want to analyse.
- Review the JQL query shown in the JQL field (1).
- Optionally update the query to suit your use case.
- Click Search (2) to refresh the report data.
The Work Items count (3) updates to show how many work items match the current query.

Step 3: Customise the Report (Optional)
Templates are already configured with dimensions, Metrics, and filters. You can start using the report immediately or customise it further based on your reporting needs.
Add or Change Dimensions
Dimensions define how the data is grouped and sliced.
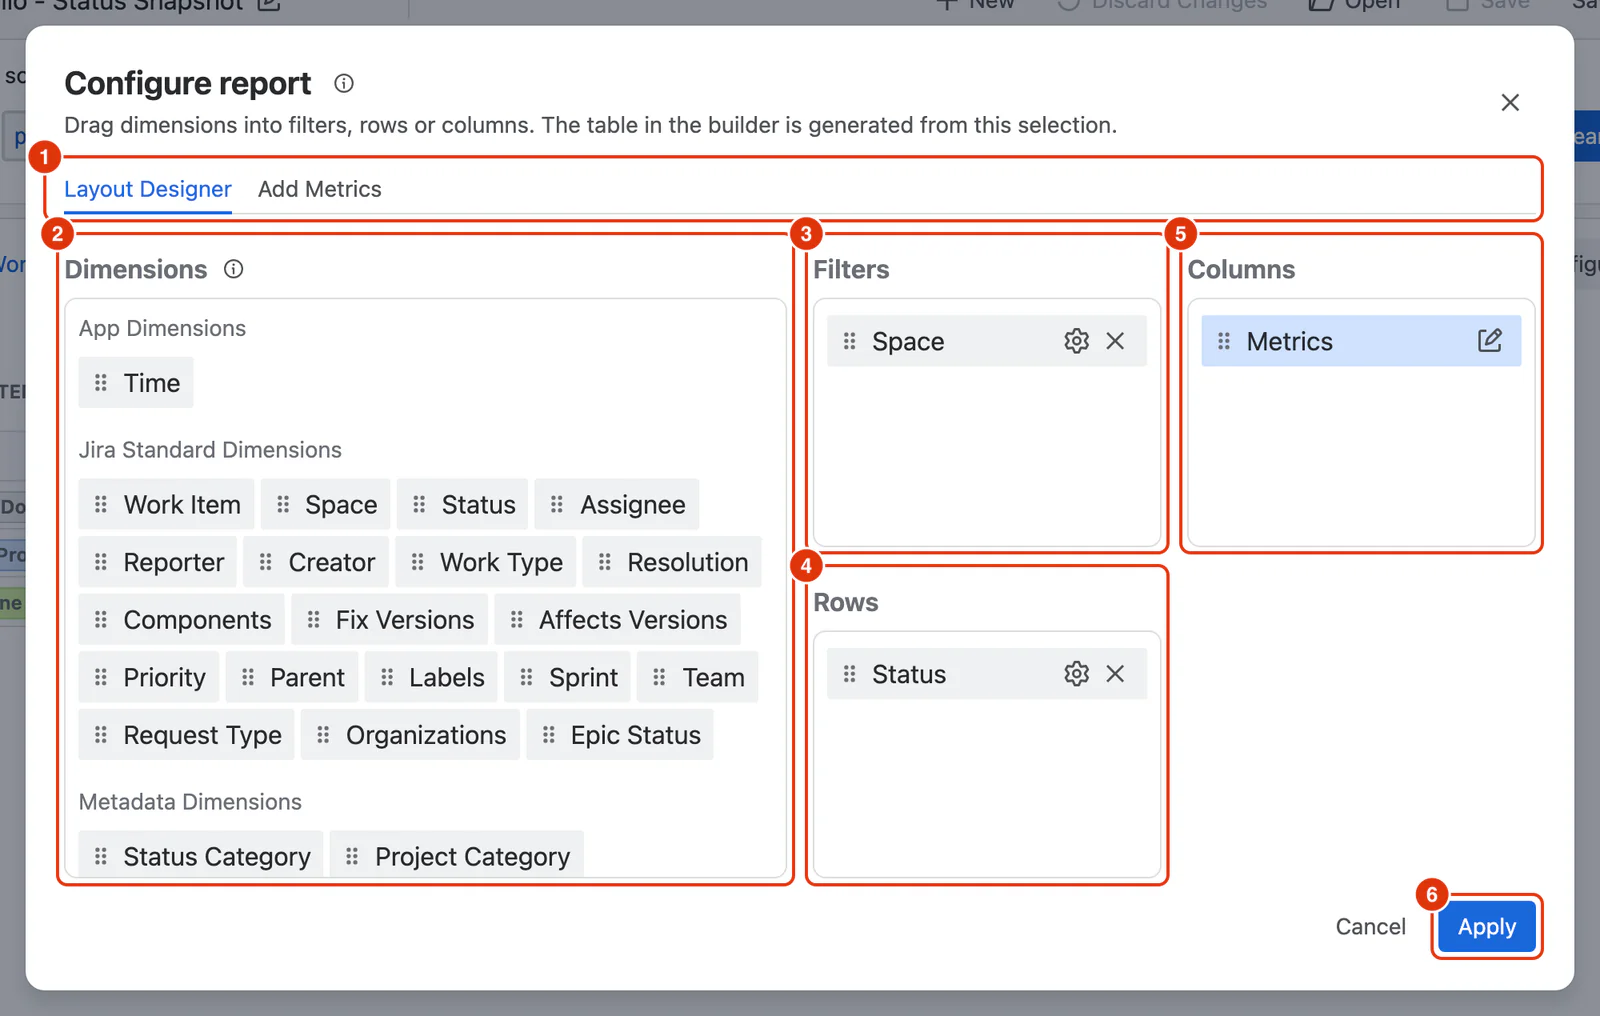
- Click the Configure button.
- On the Layout Designer tab (1), drag dimensions from the Dimensions list (2) into Filters (3), Rows (4), or Columns (5).
- Click Apply (6).
For example, you can add Space, Assignee, or Time dimensions to change how the report is organised.
Add or Change Metrics
Metrics define what values are calculated in the report.
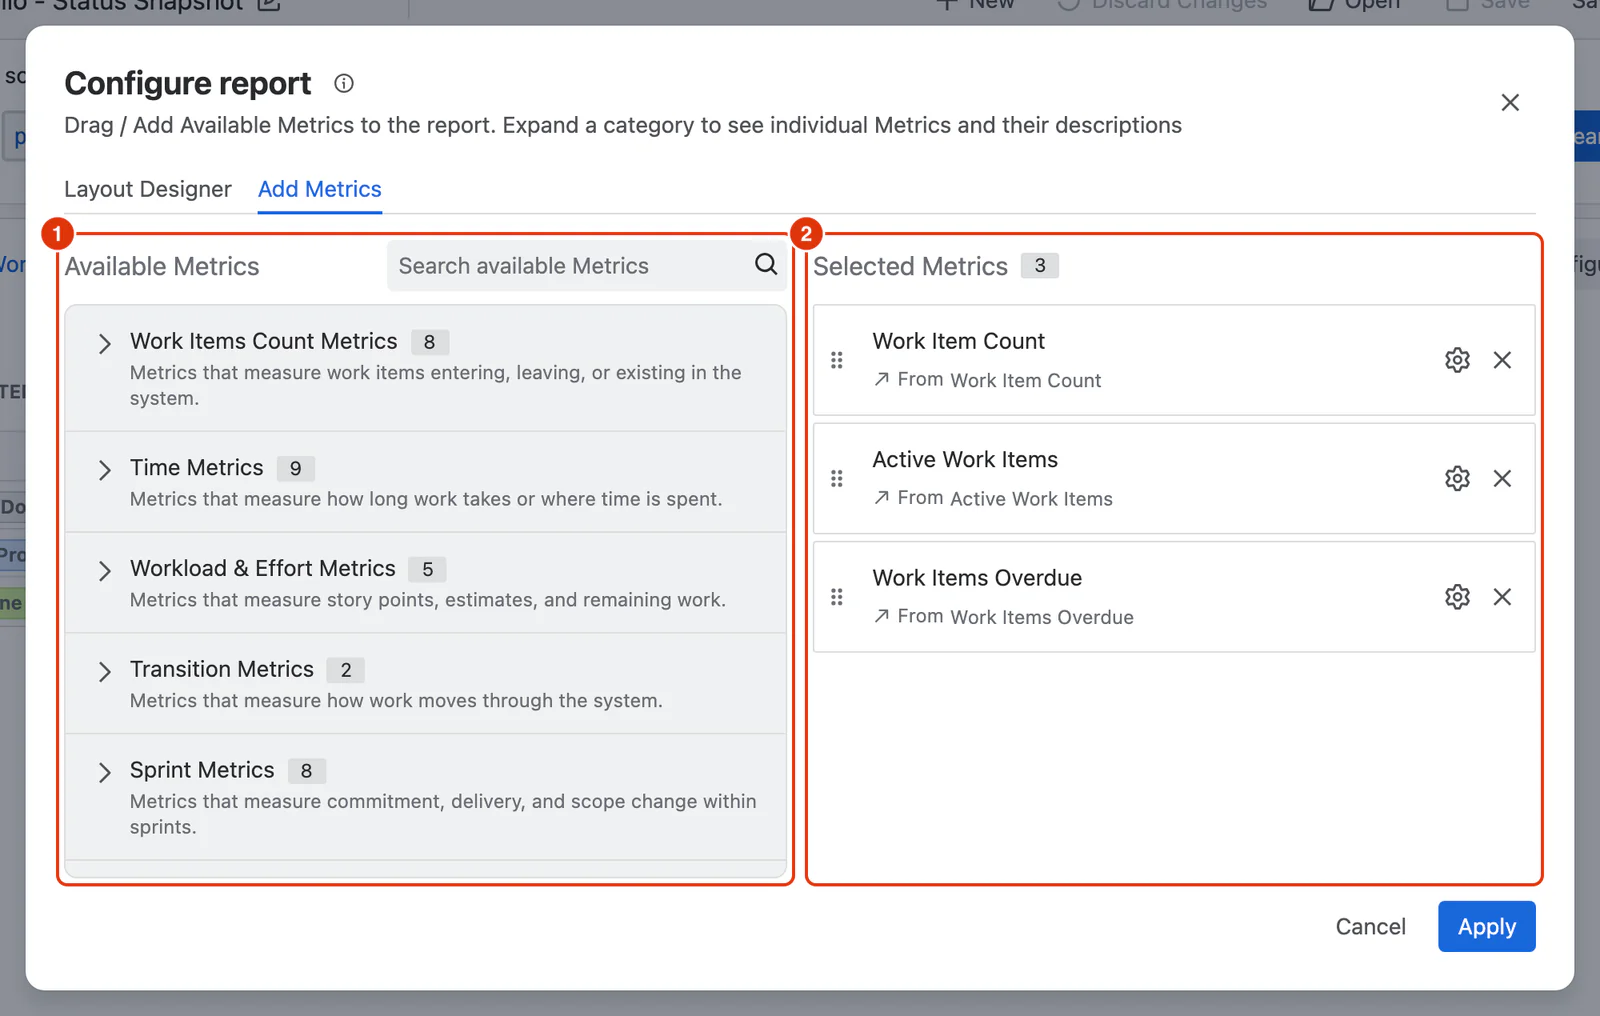
- Open the Add Metrics tab.
- Expand a category under Available Metrics (1).
- Click Add next to any Metric you want to include. It appears under Selected Metrics (2).
- Click Apply.
For example, you can add Metrics such as Work Items Created, Cycle Time, or Story Points Completed.
Add or Change Filters
Filters allow users to narrow report results interactively.
- On the Layout Designer tab, drag dimensions into the Filters zone.
- Click Apply.
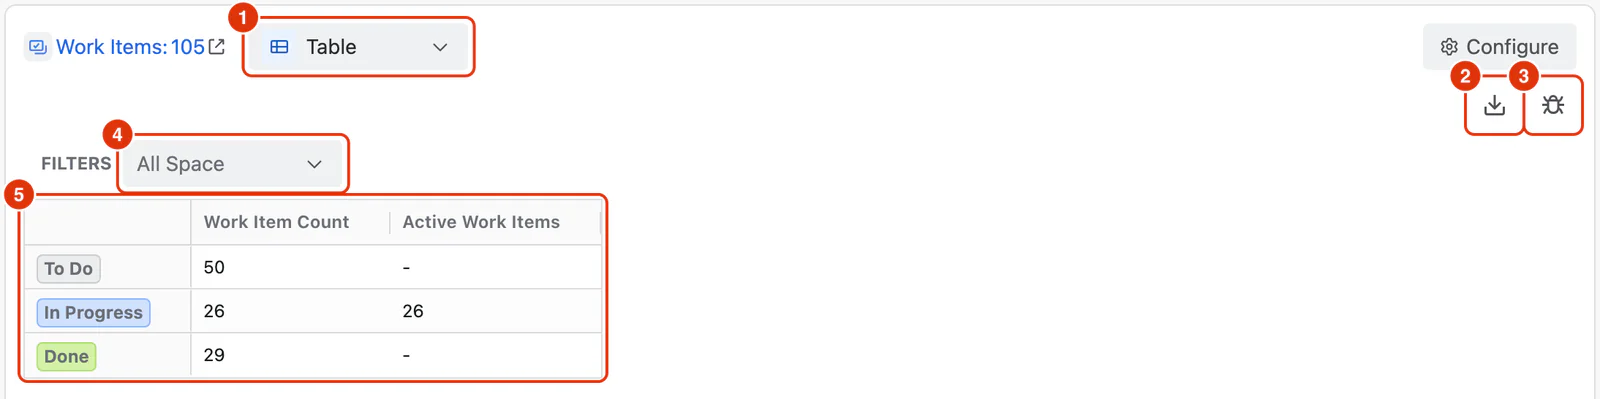
The filters (4) appear above the report and can be changed without modifying the saved report structure.
Step 4: Save the Report
- Click Save as in the toolbar.
- Enter a Report name (1) — up to 60 characters.
- Optionally add a Description (2).
- Click Save report.
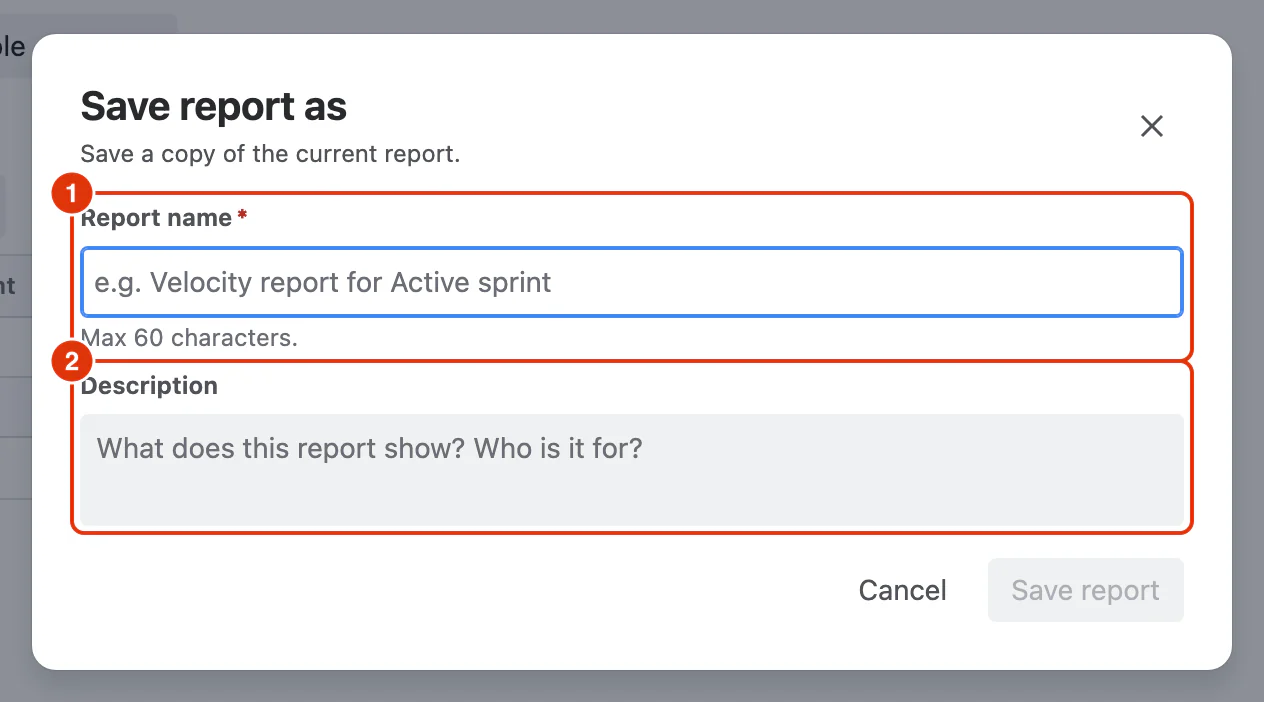
Your report is now saved and will appear on the Home screen. It is also available to embed in any Jira dashboard using the Dashlytics Statistical Report Gadget.
What's Next?
You now know the core pattern: data source → dimensions → Metrics → save. From here:
- Explore more Metrics — the Metrics reference documents every available Metric and what it measures.
- Try different dimensions — add Time to Rows to see trends over weeks or months, or swap Space for Assignee to see distribution by person.
- Embed in a dashboard — see Using Dashboards to display your saved report on a Jira dashboard.
- Set up a Work Calendar — if your team uses time-based Metrics like Cycle Time or Time in Status, configure a calendar first — see Work Calendar Setup.