
Numeric Field Aggregation
Numeric Field Aggregation measures the aggregated value of a selected numeric field across work items.
It allows users to analyse and summarise values from any numeric field, including standard Jira fields and custom numeric fields.
This Metric is flexible and configurable, enabling analysis of effort, value, cost, or any other numeric attribute.
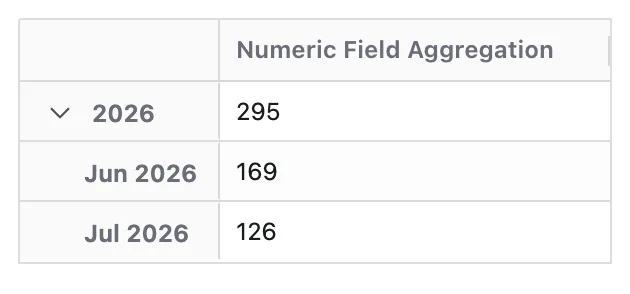
What the report shows depends on the field you choose — below, Story Points aggregated by month. Until a Numeric Field is set the report does not render at all.
What Question Does Numeric Field Aggregation Answer?
Numeric Field Aggregation is designed to answer:
What is the aggregated value of a specific numeric field across work items?
How Values Are Calculated
Numeric Field Aggregation is calculated across all work items included in the dataset. For each work item, the value of the selected numeric field is retrieved. Work items without a value in the selected field are excluded. Values are aggregated across all included work items using the selected aggregation method.
When a Time dimension is applied, work items are grouped using the selected Time Grouping Field (e.g. Created Date, Resolved Date) and aggregated values are calculated within each time period. Time represents how work items are grouped, not when the numeric value was created or changed.
Configuration
Numeric Field Aggregation adds these options to the Metric Name and Description every Metric has:
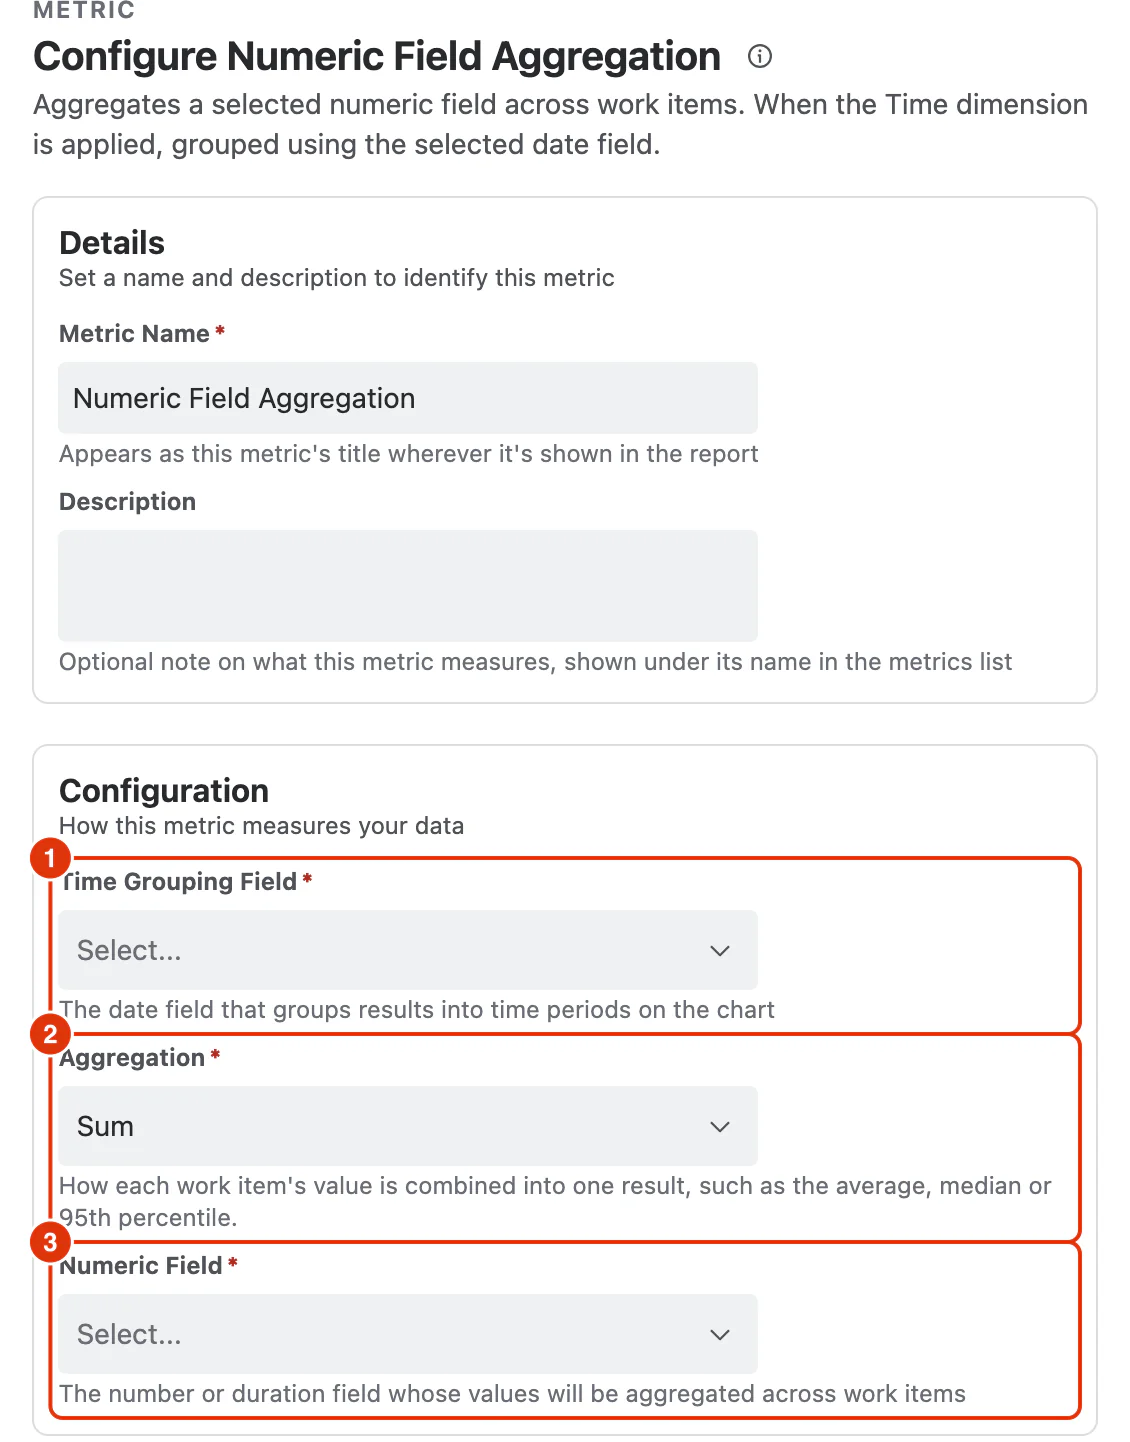
Time Grouping Field (1)
The date field that groups results into time periods when the report has a Time dimension.
Aggregation (2)
How each work item's value is combined into one result:
- Sum (default)
- Average
- Median
- Percentile (P95)
Numeric Field (3)
The number or duration field whose values are aggregated across work items.
What You Can Analyse with Numeric Field Aggregation
Numeric Field Aggregation is commonly used to analyse:
Effort and Work Size
- Total story points across work items
- Total estimates or remaining effort
- Workload distribution across teams or components
Business or Product Value
- Total business value represented by work items
- Value delivered by a sprint, release, or team
- Comparison of value across projects
Cost and Resource Metrics
- Total cost associated with work items
- Budget consumption across initiatives
- Financial distribution of work
Distribution of Numeric Metrics
- Breakdown of numeric values by project, assignee, sprint, or status
- Identification of areas with higher effort or value concentration