
Using Dashboards
Dashlytics reports can be displayed on Jira dashboards using two types of gadgets — the Dashlytics Controller Gadget and the Dashlytics Statistical Report Gadget. You can use the Statistical Report Gadget on its own, or combine it with a Controller Gadget for a more dynamic, connected dashboard.
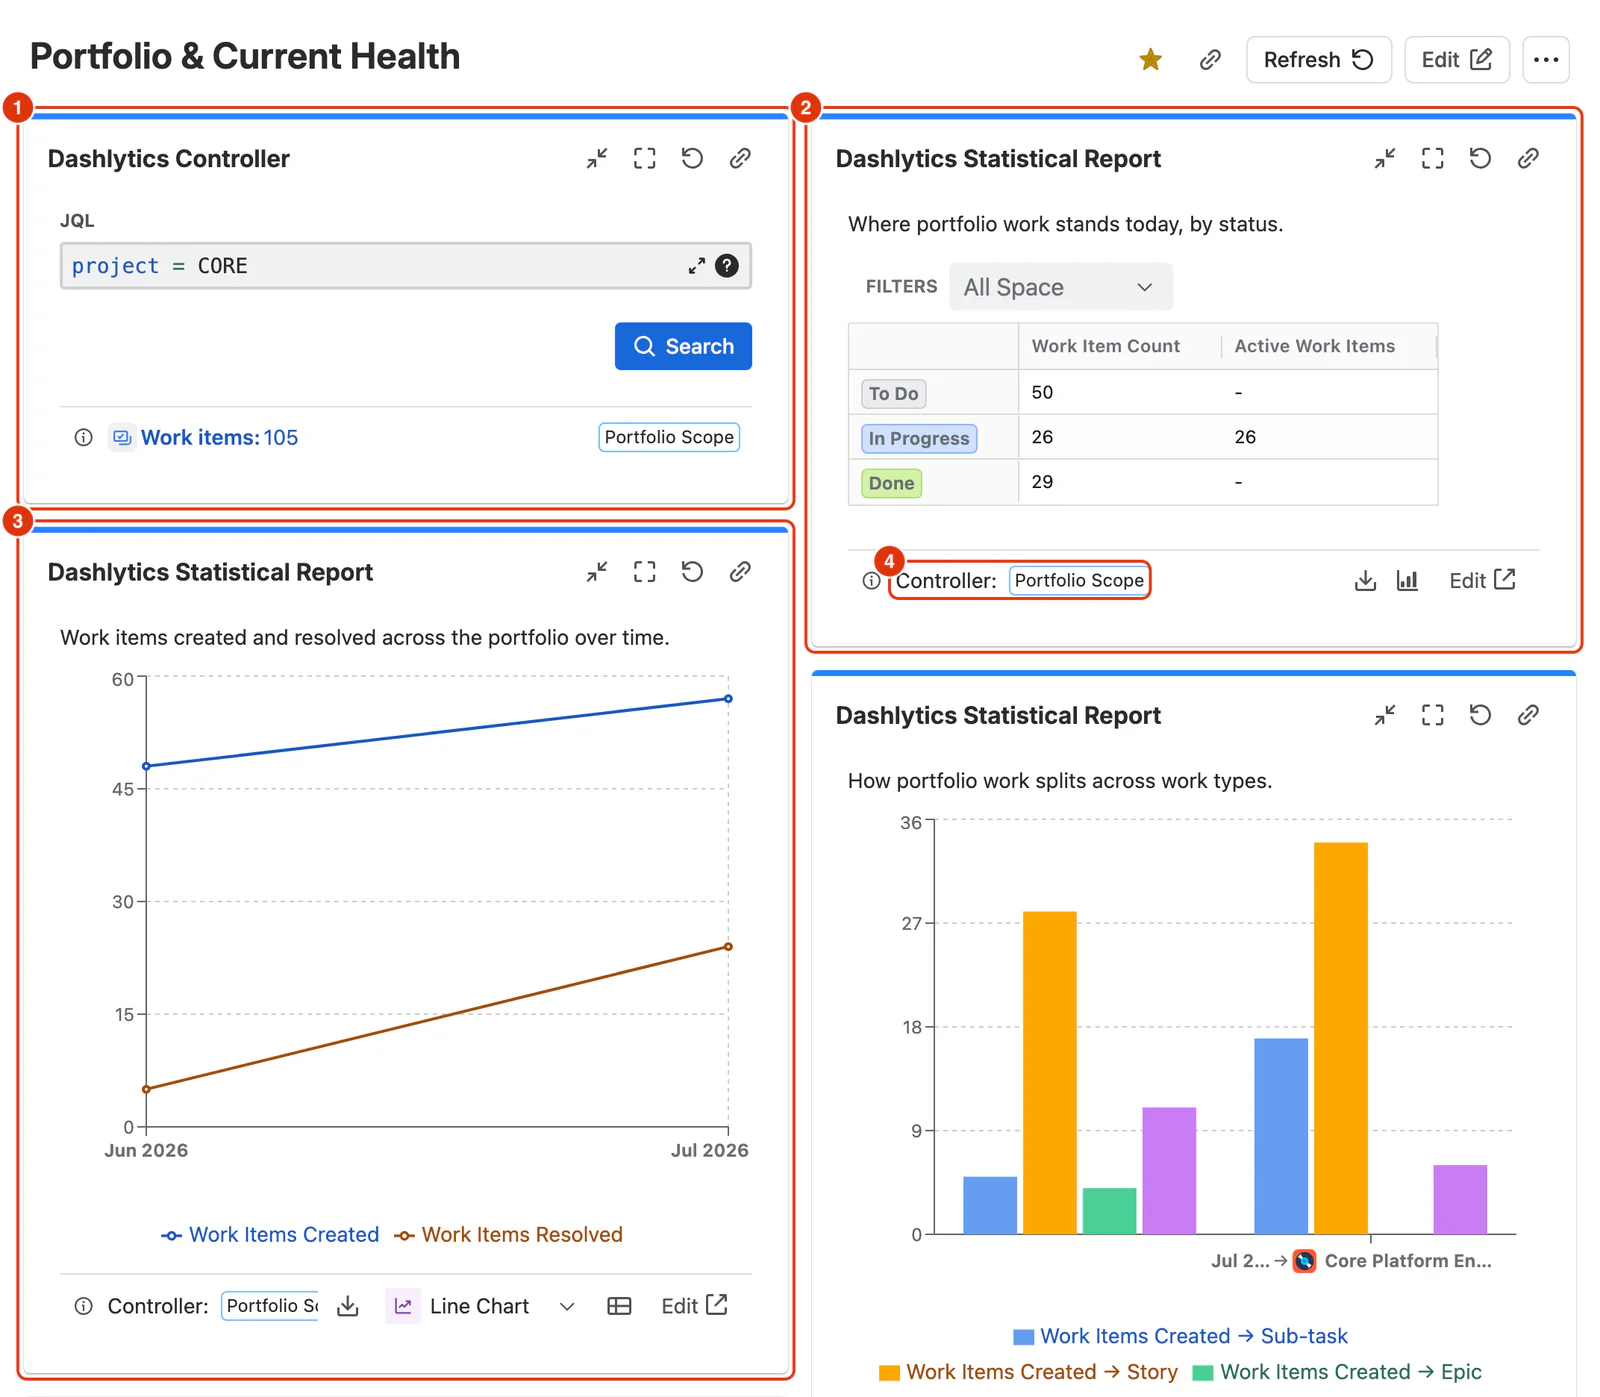
How the Two Gadgets Work Together
The Dashlytics Statistical Report Gadget displays a saved Dashlytics report on your dashboard. When adding it, you choose how its data source works:
- Use report data source — the gadget uses the JQL defined in the saved report itself. No Controller Gadget is needed. This is the simplest setup and works well when each report on your dashboard has its own fixed scope.
- Use its own JQL — the gadget runs the report on a JQL query entered in the gadget itself, leaving the saved report unchanged. No Controller Gadget is needed. Use it when one gadget needs a different scope from its report.
- Use a Controller — the gadget gets its data from a Dashlytics Controller Gadget on the same dashboard. When the Controller's JQL is updated, every Statistical Report Gadget connected to it automatically refreshes — making it easy to keep multiple reports in sync without editing each gadget individually.
The Dashlytics Controller Gadget is optional. Add one only when you want multiple Statistical Report Gadgets on the same dashboard to share a single, updateable data source. You can add multiple Controller Gadgets to a single dashboard, allowing different groups of Statistical Report Gadgets to use different data sources.
Setting Up the Statistical Report Gadget
To add a Statistical Report Gadget:
- Open your Jira dashboard and click Edit dashboard.
- Click Add gadget and search for Dashlytics Statistical Report Gadget.
- Click Add to place it on the dashboard.
- In the gadget's edit mode:
- Report (1) — choose from any saved Dashlytics report.
- Description (2) — optionally, a short note shown at the top of the gadget. It is filled in from the report's description, and you can change it.
- Data Source (3) — choose Use Data Source from selected report, Enter a JQL query and type the query, or Select a Controller gadget and pick the Controller.
- Click Save (4).
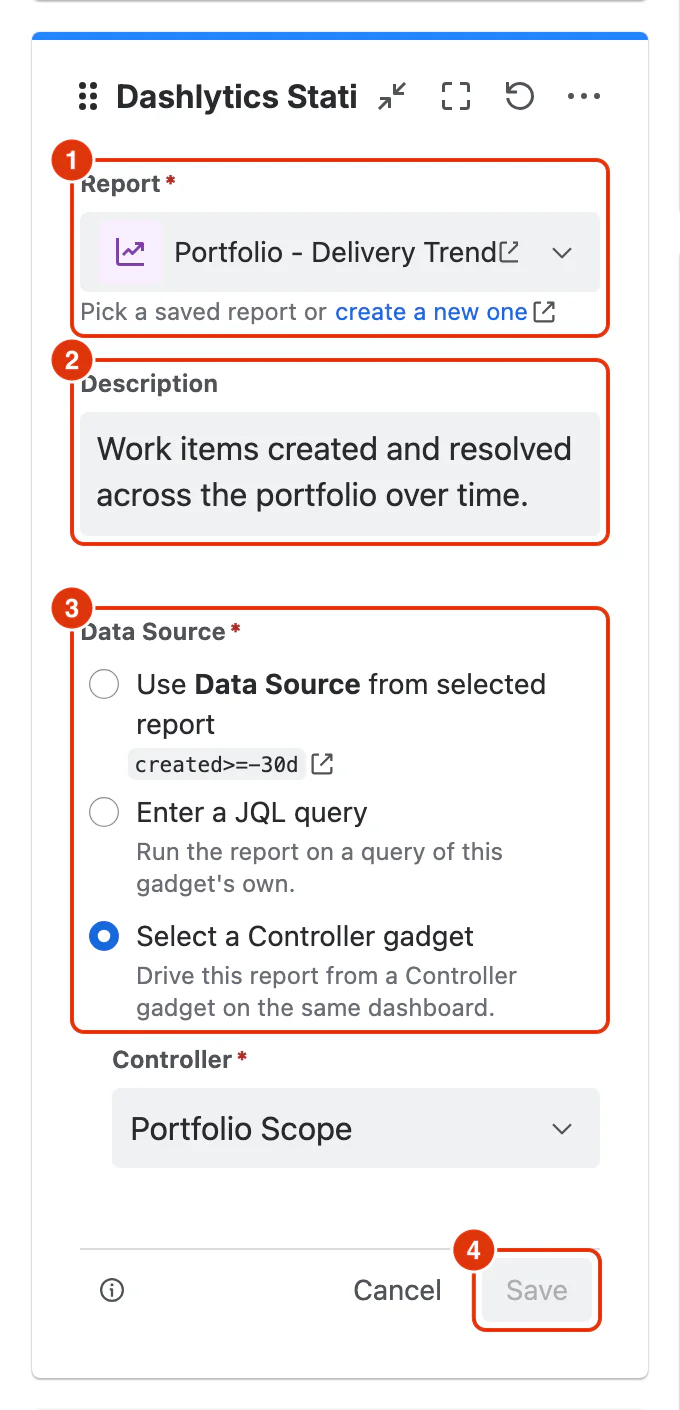
For a detailed breakdown of every option in the gadget edit modes, see Dashlytics Statistical Report Gadget in the Dashlytics UI Guide.
Setting Up the Controller Gadget
Use the Controller Gadget when you want multiple Statistical Report Gadgets on the same dashboard to share a single data source that can be updated in one place.
To add a Controller Gadget:
- Open your Jira dashboard and click Edit dashboard.
- Click Add gadget and search for Dashlytics Controller Gadget.
- Click Add to place it on the dashboard.
- In the gadget's configure form, enter a Name (1) for the Controller — this name appears in the Statistical Report Gadget when selecting a data source, so choose something descriptive.
- Click Save (2).
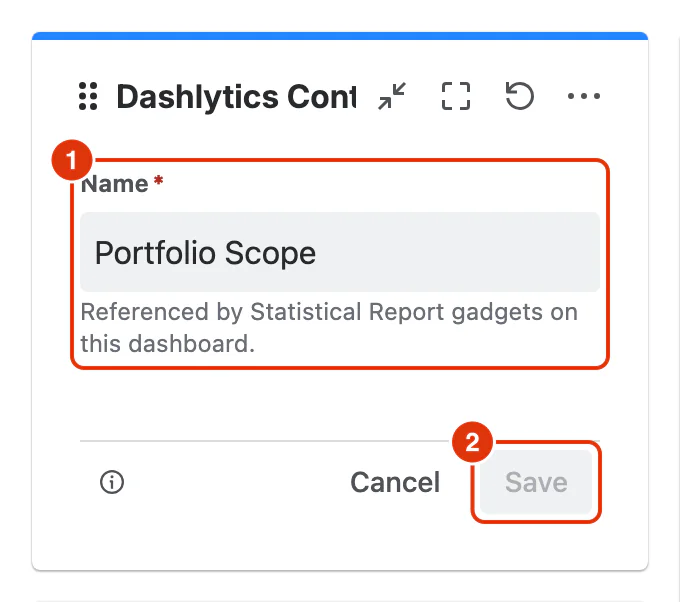
Tip: Give your Controller a clear, meaningful name — especially when you have multiple Controllers on the same dashboard. This makes it easy to identify the right one when configuring Statistical Report Gadgets.
Setting the Controller JQL
Once the Controller Gadget is on your dashboard, enter the JQL query directly in the gadget's view mode:
- Type a JQL query into the JQL field on the Controller Gadget.
- Click Search to apply the query.
The gadget displays the number of matching Work items. All Statistical Report Gadgets connected to this Controller refresh to reflect the updated results.
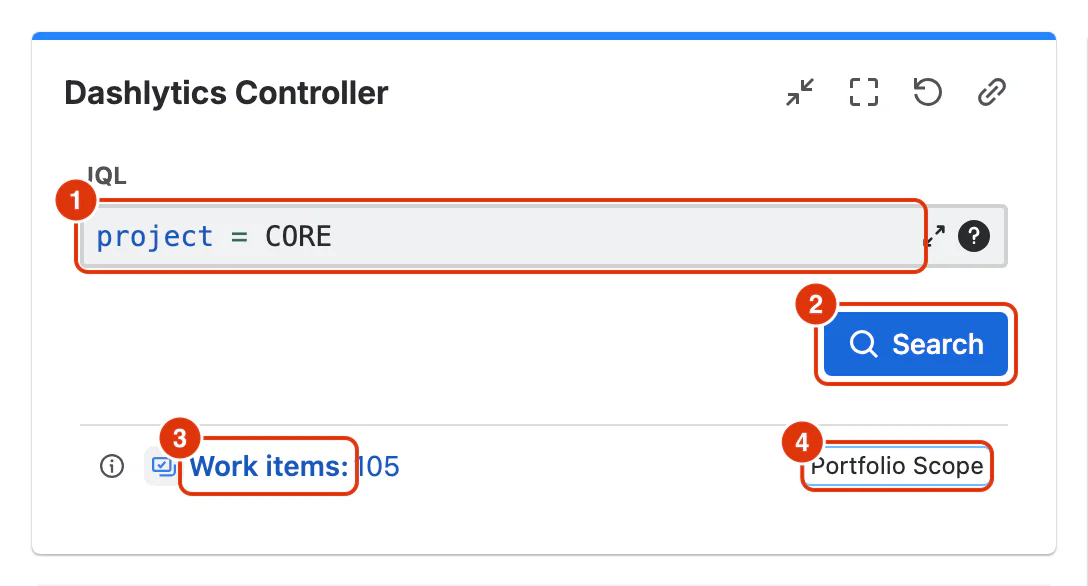
Interacting with the Statistical Report Gadget
Once configured, the Statistical Report Gadget displays your report in view-only mode. You can:
- Filter results — use the filter dropdowns above the report table to narrow results. Filters are only available for dimensions placed in the Filters zone of the report's Configure dialog.
- Switch between table and chart — use the toggle button to switch the report between the table and chart view. When viewing a chart, choose between Bar, Line, and Area chart. The gadget opens in the view format saved with the report.
- Download the report — click the Download report icon in the gadget footer to export the current report as CSV, Excel, or PDF. See Exporting Reports for details.
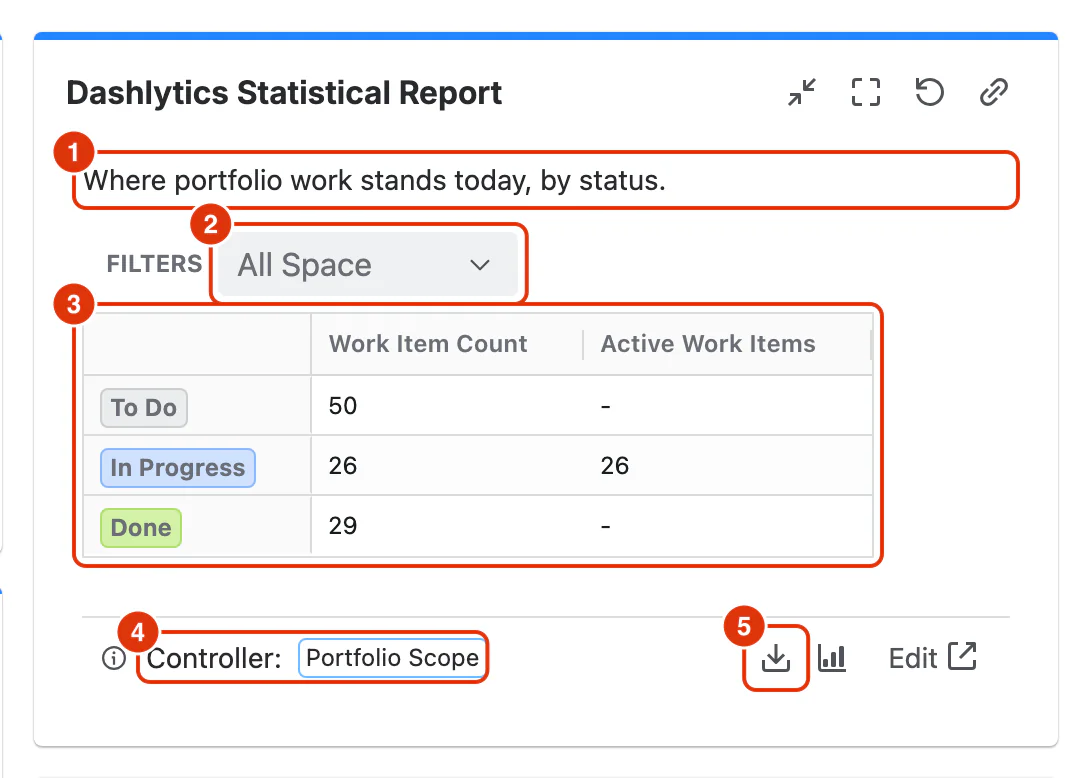
For a detailed breakdown of every element in the gadget view mode, see Dashlytics Statistical Report Gadget in the Dashlytics UI Guide.