
Work Items Created
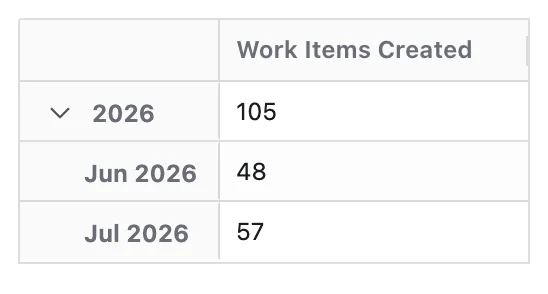
Work Items Created measures the number of new work items that enter your system.
It represents the volume of new work entering the system, using the work item's Created Date as the reference point.
This Metric focuses only on counting newly created work items. It does not consider:
- Effort or story points
- Workflow duration or time to complete
- Current status or completion state
What Question Does Work Items Created Answer?
Work Items Created is designed to answer:
- How much new work entered the system?
- When did that new work arrive?
By tracking this Metric over time, teams can see how demand is changing and whether intake patterns are stable or volatile.
How Work Items Are Counted
- Each work item is counted once, at the moment it is created.
- When the Time dimension is applied, work items are grouped into time periods based on their Created Date.
This means:
- A work item always appears in the time period that matches its Created Date.
- Later changes (status updates, transitions, resolution) do not affect when it is counted for this Metric.
Configuration
Work Items Created does not require any date field configuration.
- The Metric always uses the standard Jira Created Date field.
- No custom date fields or workflow events are needed.
Its configuration panel offers no options of its own — only a Metric Name and a Description, as described in Metric Configuration.
What You Can Analyse with Work Items Created
Work Items Created is commonly used to analyse:
Demand Trends
Understand how incoming work changes over time:
- Growth or decline in overall incoming work
- Seasonal patterns or recurring peaks (e.g. release cycles, quarter ends)
- Sudden spikes caused by incidents, releases, or organisational changes
Intake Distribution
See where new work is coming from:
- Which spaces, products, or teams generate the most new work items
- Breakdown of incoming work by:
- Work type (e.g. bug, story, task)
- Priority (e.g. blocker, high, medium)
- Component, service, or area
Capacity Pressure Signals
Identify potential overload before it impacts delivery:
- Whether incoming demand is outpacing delivery over time
- Periods where intake volume exceeds historical norms, indicating rising pressure on teams
- Early signals that you may need to rebalance work, adjust capacity, or reprioritise demand