
Key Capabilities
Dashlytics is built around four core capabilities. Understanding what each one does — and why it exists — helps you get the most out of the app.
Report Builder
The Report Builder is where you create reports.
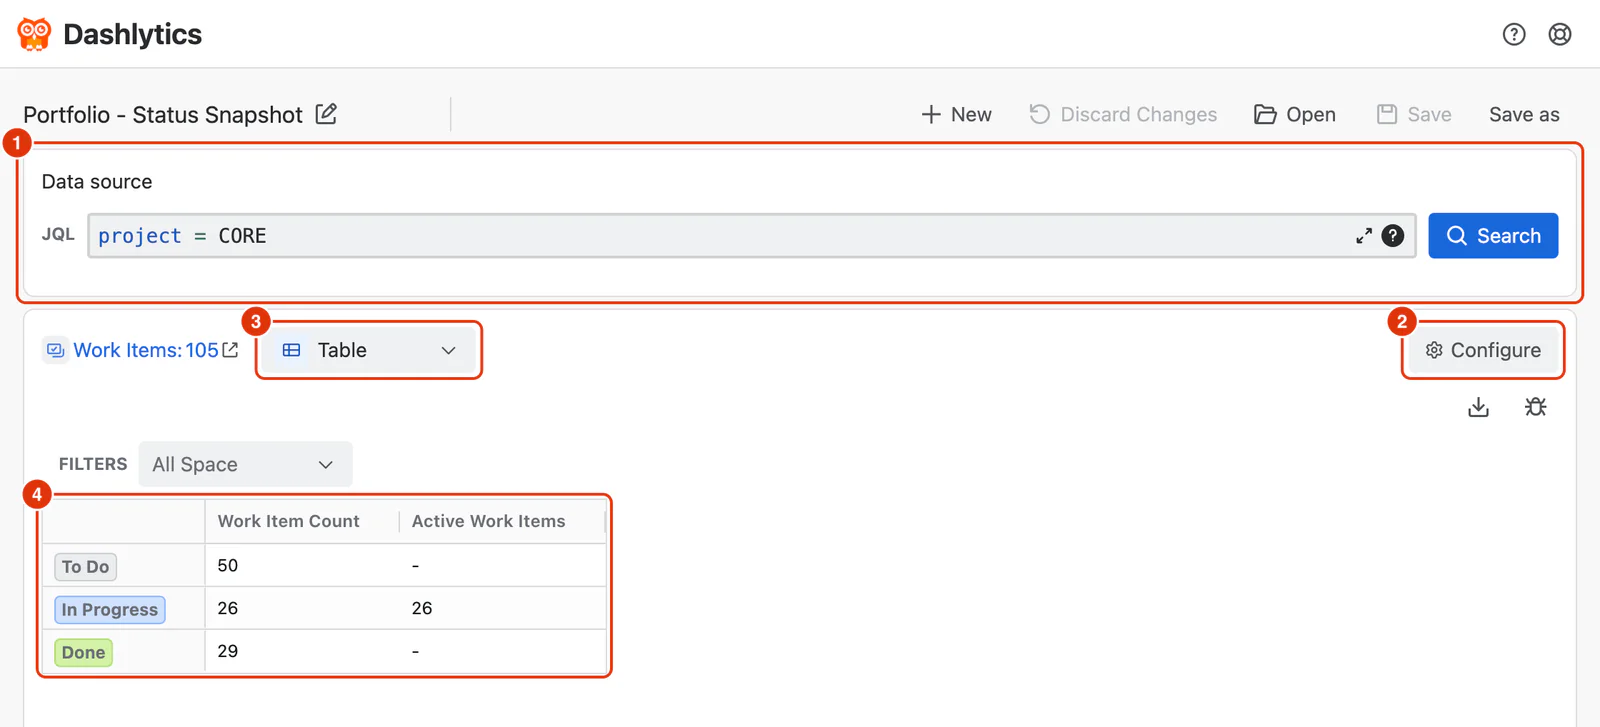
You start by defining a data source (1) — a JQL query that determines which work items are included. From there, click Configure (2) to arrange dimensions (such as Space, Assignee, Status, Sprint, or Time) into rows, columns, and filters to control how your data is sliced, and to add Metrics — calculations like work item counts, story points, or cycle times — which appear as columns in the report.
The result is a structured report (4) that answers a specific question about your Jira data. Reports are saved and can be reused, shared, or embedded into dashboards. Each report can be viewed as a table or as a bar, line, or area chart, using the view format selector (3).
See Building Reports for a step-by-step guide.
Metrics
Metrics are the calculations at the heart of every report, added to a report from the Add Metrics tab of the Configure dialog.
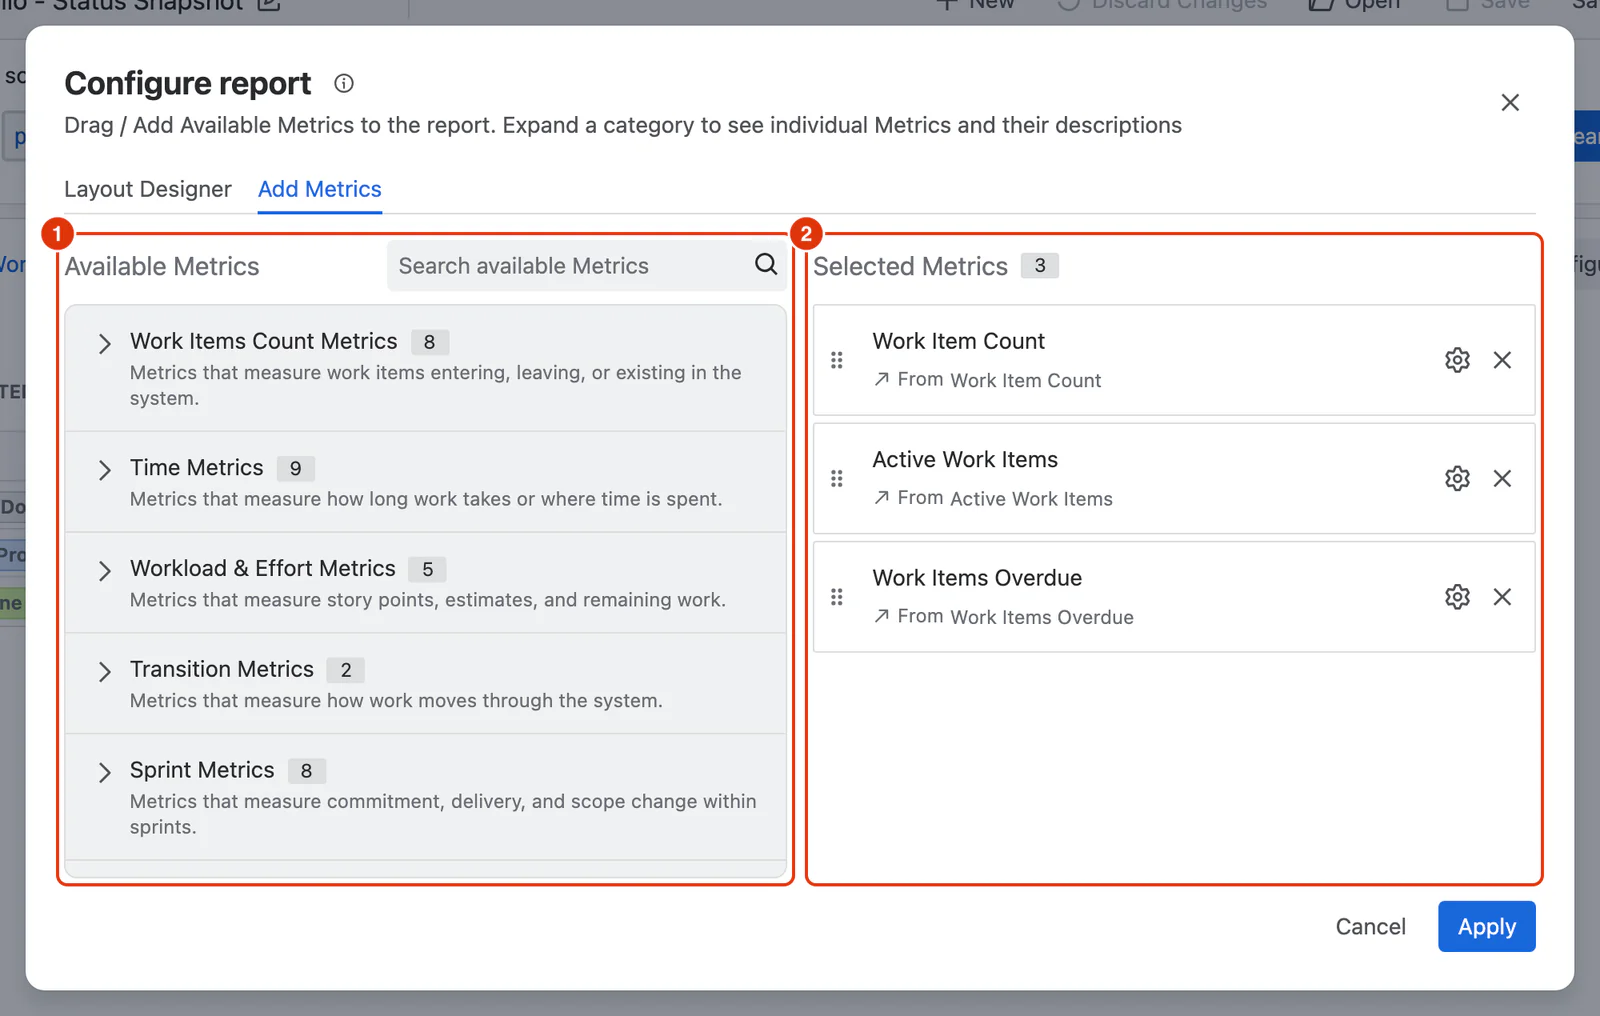
Dashlytics includes a library of pre-built Metrics organised into categories (1) — work item counts, sprint delivery metrics, story points, time-based metrics (such as Lead Time, Cycle Time, and Time in Status), workload and effort tracking, and workflow transition counts. Generic Metrics are also available for custom numeric field analysis. The Metrics you add to a report are listed under Selected Metrics (2).
Each Metric is designed to answer a specific analytical question. The same Metric can be added multiple times to a single report with different configurations, allowing side-by-side comparisons — for example, adding Time in Status twice, once configured for In Progress and once for In Review, to compare how long work items spend in each status.
See the Metrics reference for every Metric and what it measures.
Dashboard Gadgets
Once a report is saved, it can be embedded into any Jira dashboard using the Dashlytics Statistical Report Gadget.
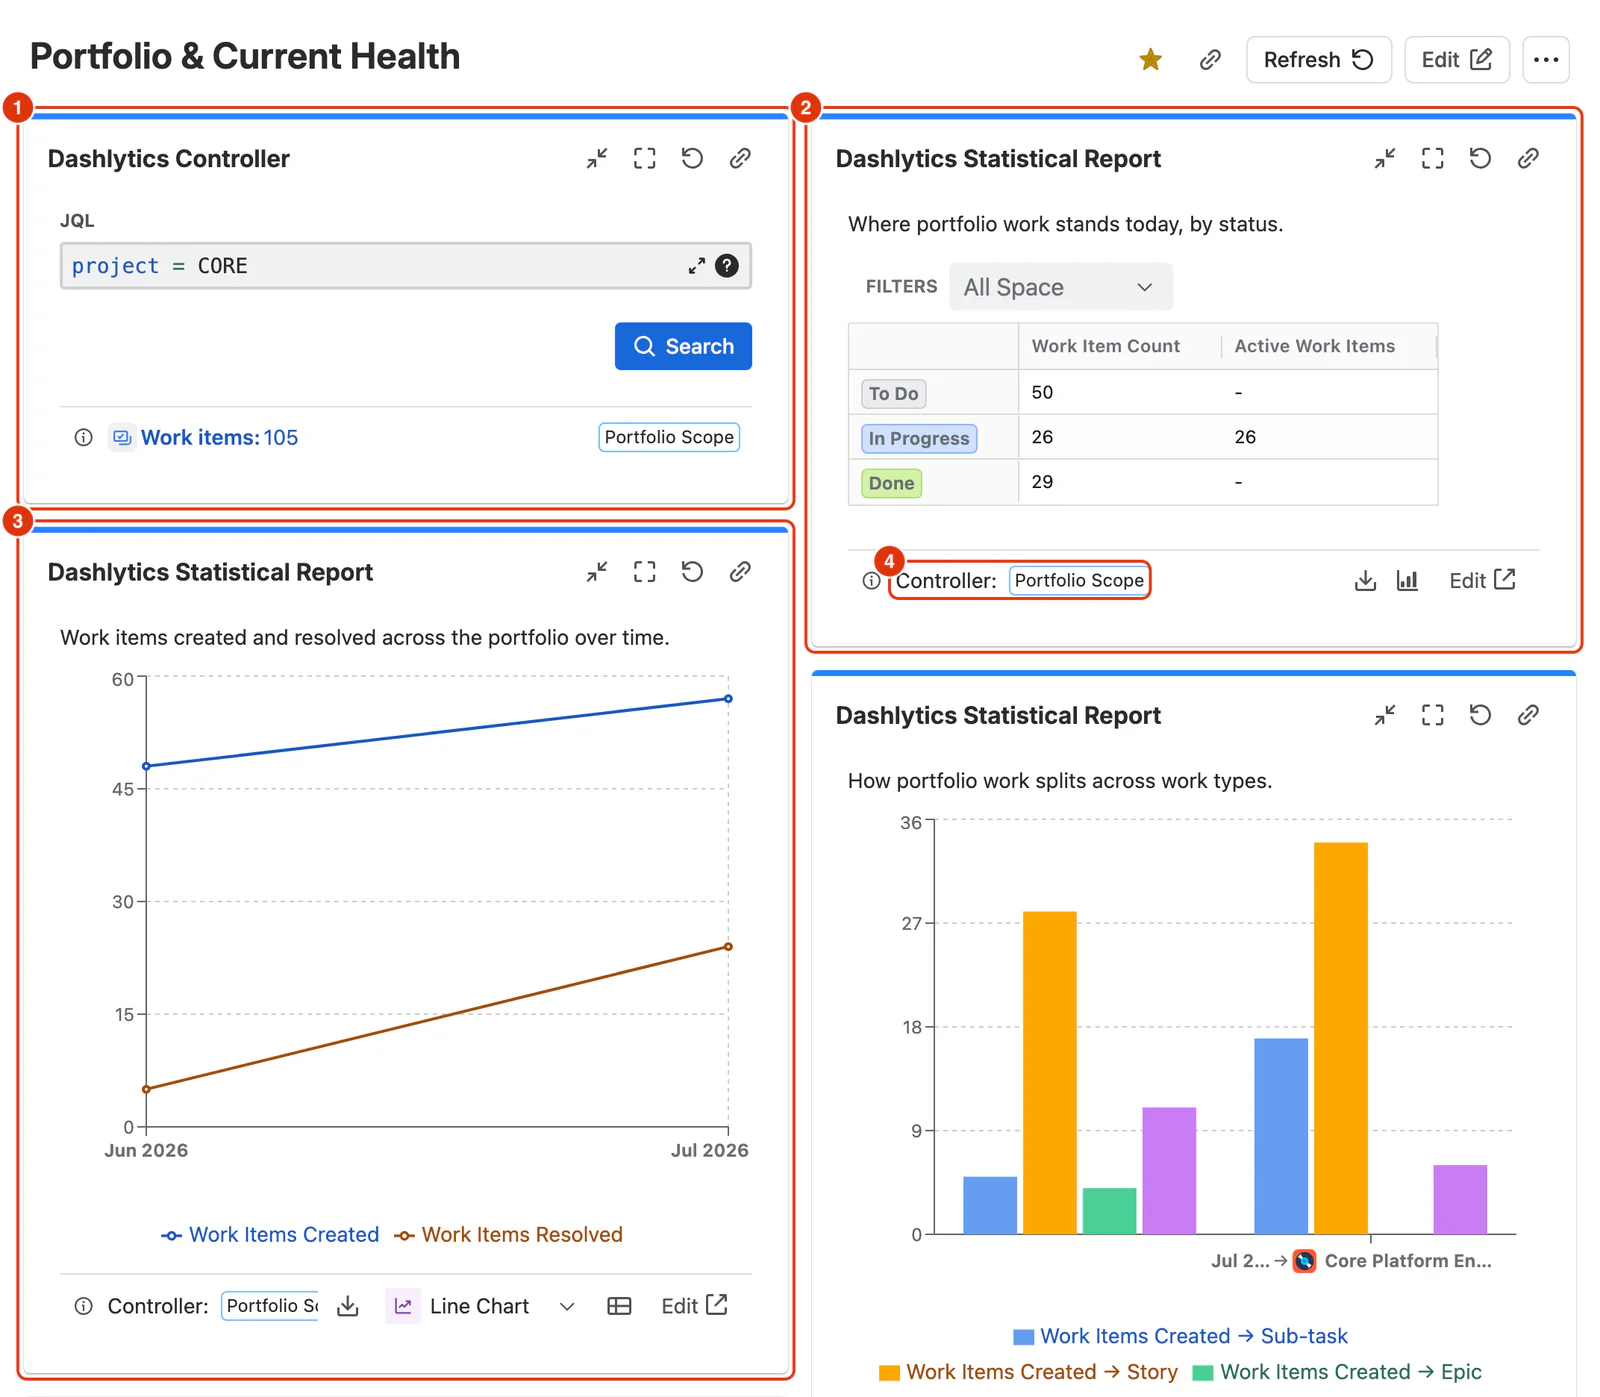
The gadget displays the report in an interactive, read-only format, as a table (2) or a chart (3). Viewers can adjust filter values to narrow the results without changing the saved report configuration.
For dashboards where multiple gadgets should reflect the same set of work items, the Dashlytics Controller Gadget (1) provides a shared JQL data source. Each connected gadget names its Controller (4). Updating the Controller's query refreshes all connected gadgets at once, making it easy to keep a whole dashboard in sync.
See Using Dashboards to set up both gadgets.
Work Calendars
Many Metrics measure how long things take — and "how long" depends on whether you're counting calendar time or working time. Work Calendars let you define your team's working hours and public holidays. When a work calendar is applied to a time-based Metric, durations are calculated against actual working time rather than elapsed days.
This matters most for Metrics like Cycle Time, Lead Time, and Time in Status, where a weekend or a public holiday sitting in the middle of a work item's lifecycle should not inflate the result.
See Work Calendar Setup to create one.