
Building Reports
The Report Builder is where you create and work with reports in Dashlytics. To open it, go to Apps → Dashlytics in the Jira left sidebar, then click Report Builder in the sidebar.
A report is built in four steps: set the data source, configure the structure, review the result, and save it.
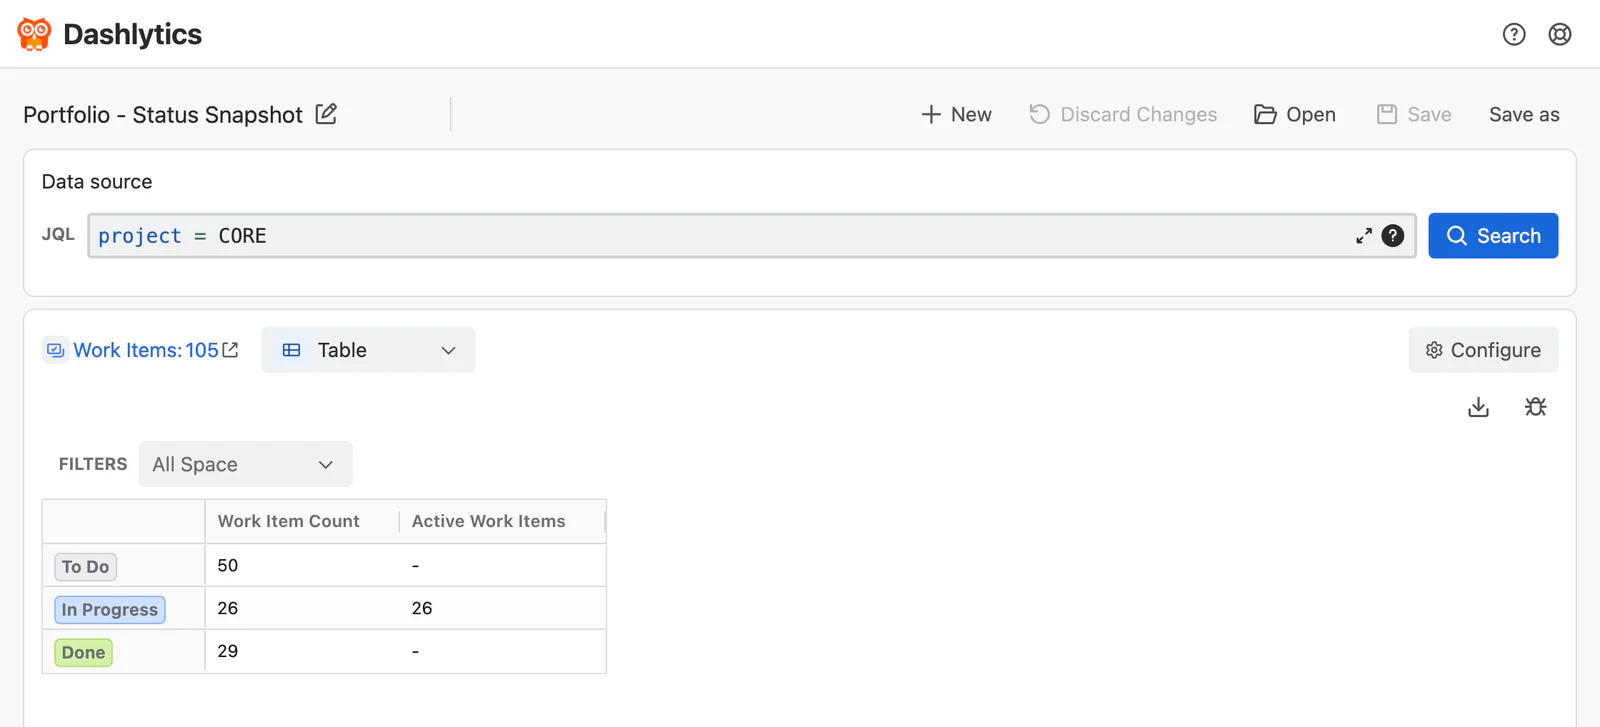
Step 1: Set the Data Source
The Data Source defines which Jira work items your report is built from.
- Enter a JQL query in the JQL field (1) and click Search (2) to fetch matching work items.
- The total number of matching work items is shown in the Work Items count (3) once the search runs.
- Click the external link icon next to the count to open the full list in Jira.

Example query:
Step 2: Configure the Report
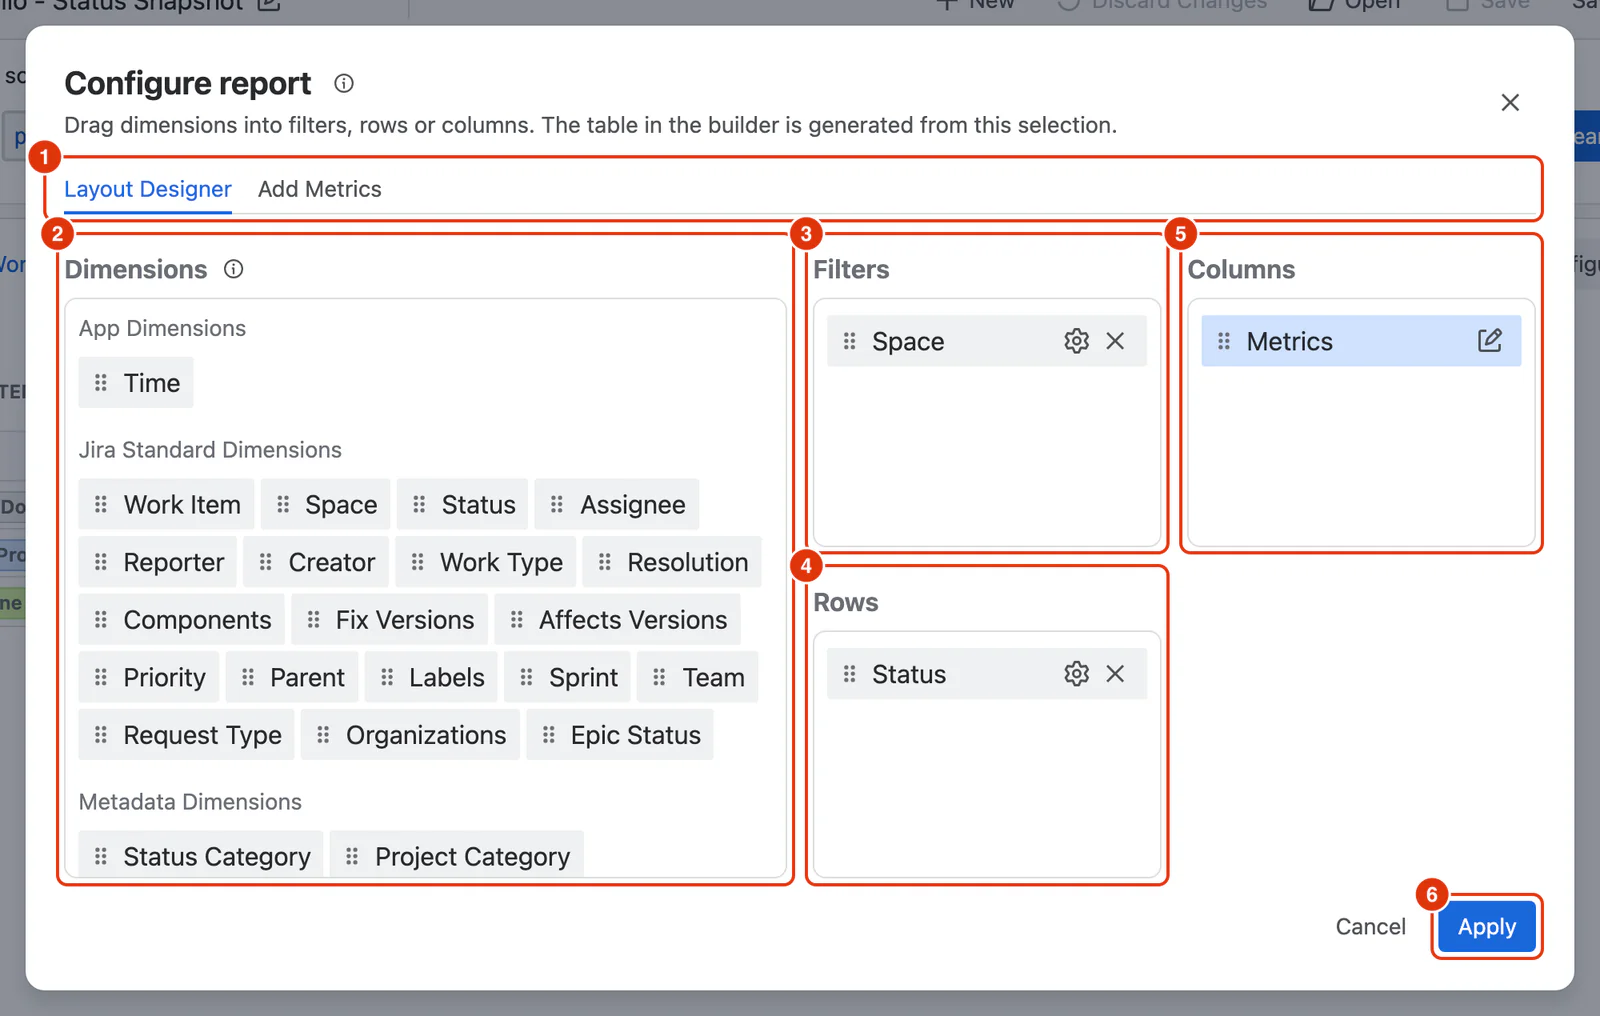
Click Configure to open the Configure report dialog. This is where you define the structure of your report — what to group by and what to measure.
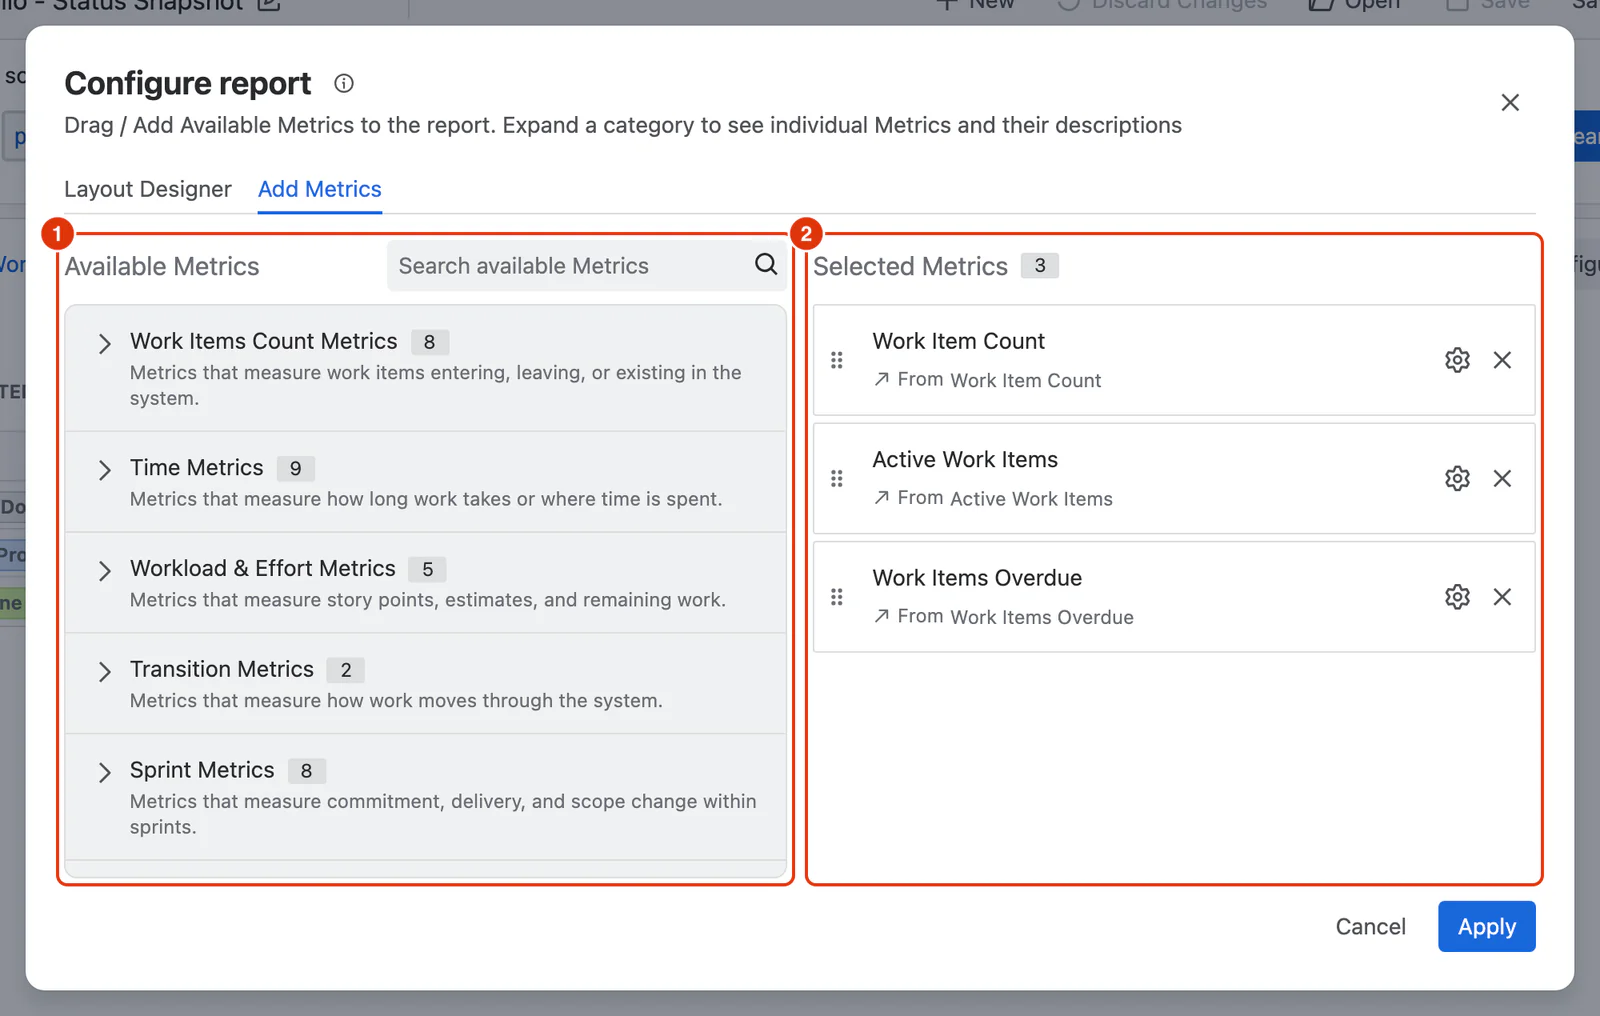
The dialog has two tabs (1): Layout Designer and Add Metrics. The report will not render until at least one dimension is placed in Rows and at least one Metric is added.
On the Layout Designer tab, drag dimensions from the Dimensions list (2) into Filters (3), Rows (4) or Columns (5), then click Apply (6).
On the Add Metrics tab, expand a category under Available Metrics (1) and add the Metrics you need. They are listed under Selected Metrics (2).
For a detailed walkthrough of all options in the Configure dialog, see Configuring a Report.
Step 3: Review the Report
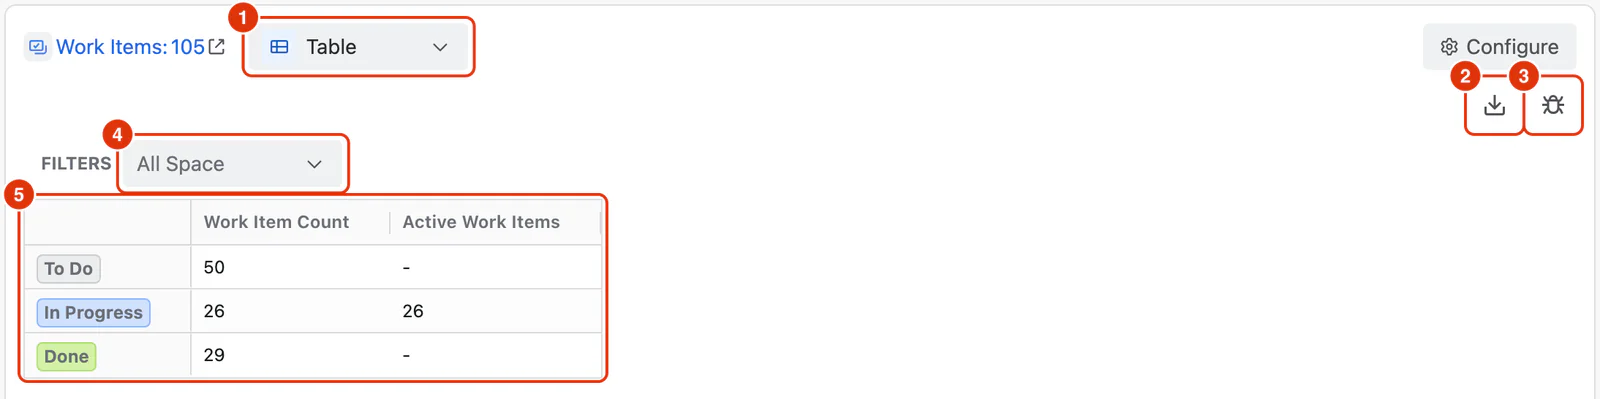
Once you click Apply, the report (5) renders below the Work Items count.
- By default the report is shown as a Table. To visualise the same data as a chart, use the view format selector (1) and choose Bar Chart, Line Chart, or Area Chart — your selection is saved with the report. See Report Charts for details on each chart type and its options.
- Use the Export icon (2) to download the current report, or the Download debug data icon (3) to prepare diagnostic information for Support. See Exporting Reports and Downloading Debug Information for the full workflows.
- A filter (4) appears for each dimension you placed in the Filters zone of the Configure dialog. Use these to narrow the report results without changing its structure. To filter by a dimension that is not listed there yet, go back to Configure and add that dimension to the Filters zone.
- Rows and columns (5) reflect the dimensions and Metrics you configured.
Step 4: Save the Report
When you are happy with the report, save it so it appears on the Home screen and is available to be used in the Dashlytics Statistical Report Gadget.
- Click Save to save changes to the currently open report.
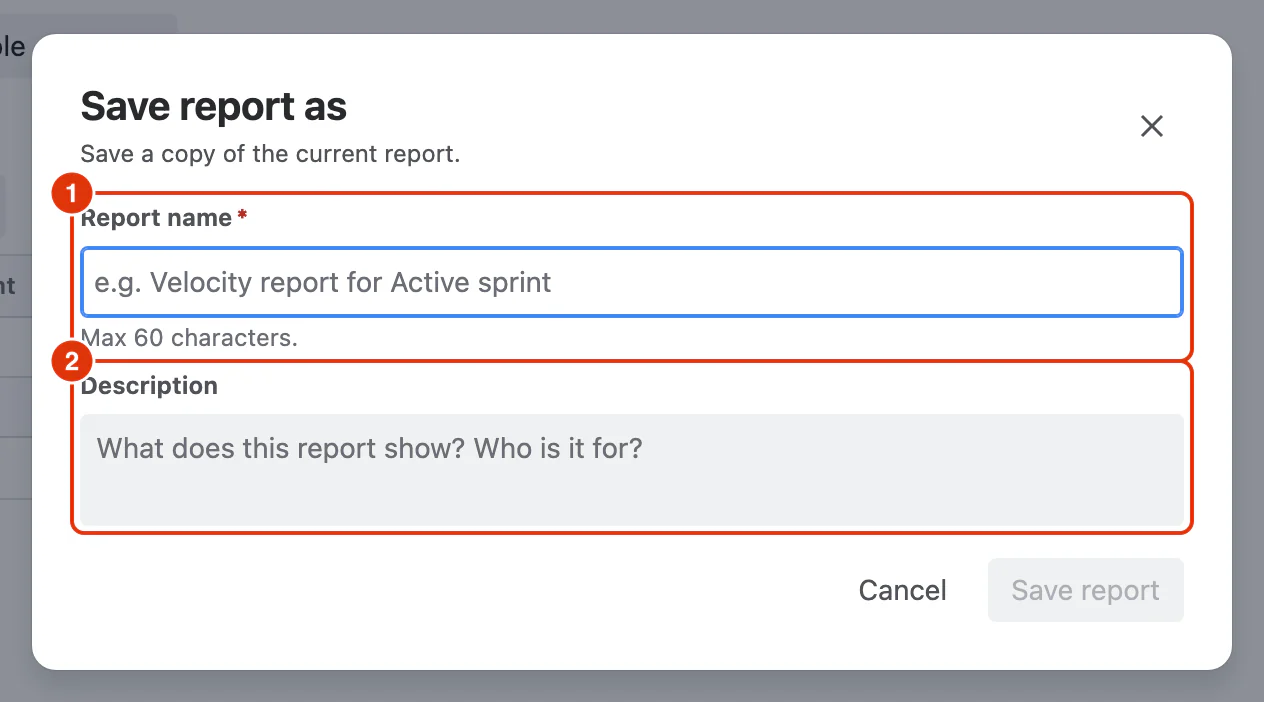
- Click Save as to save a copy as a new report. Enter a unique Report name (1), up to 60 characters, and an optional Description (2), then click Save report.
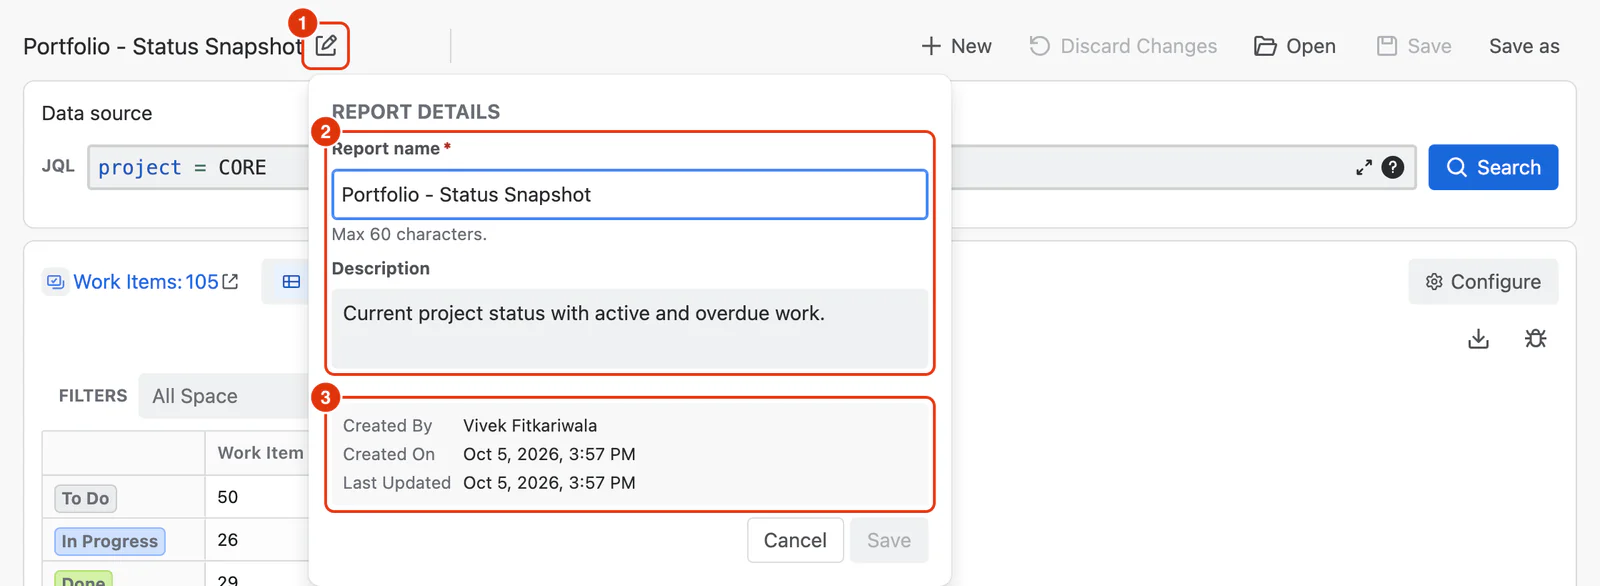
To change a saved report's name or description later, click the Edit Report Details icon (1) next to its name. The panel shows the name and description (2), which you can edit and save, and who created the report and when it was last updated (3).
Opening an Existing Report
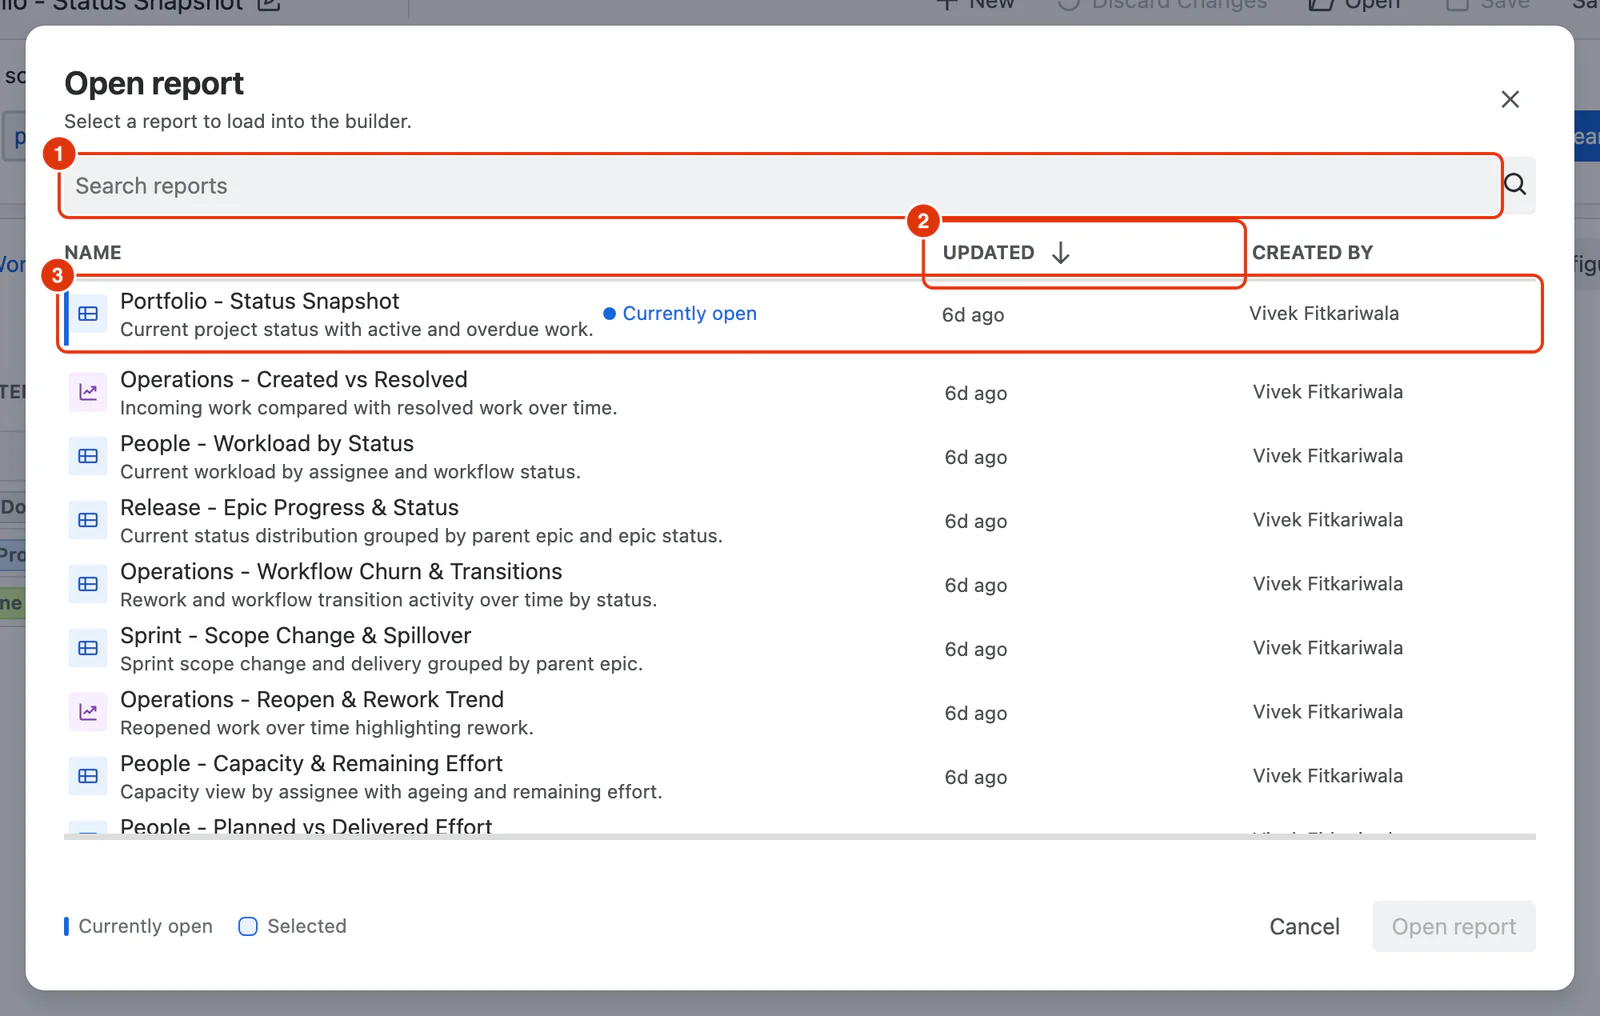
Click Open in the toolbar to load a previously saved report into the builder. Use the search field (1) to find a report by name. Reports are sorted by most recently Updated (2), and each shows who created it. The report you have open is pinned at the top with a Currently open label (3).
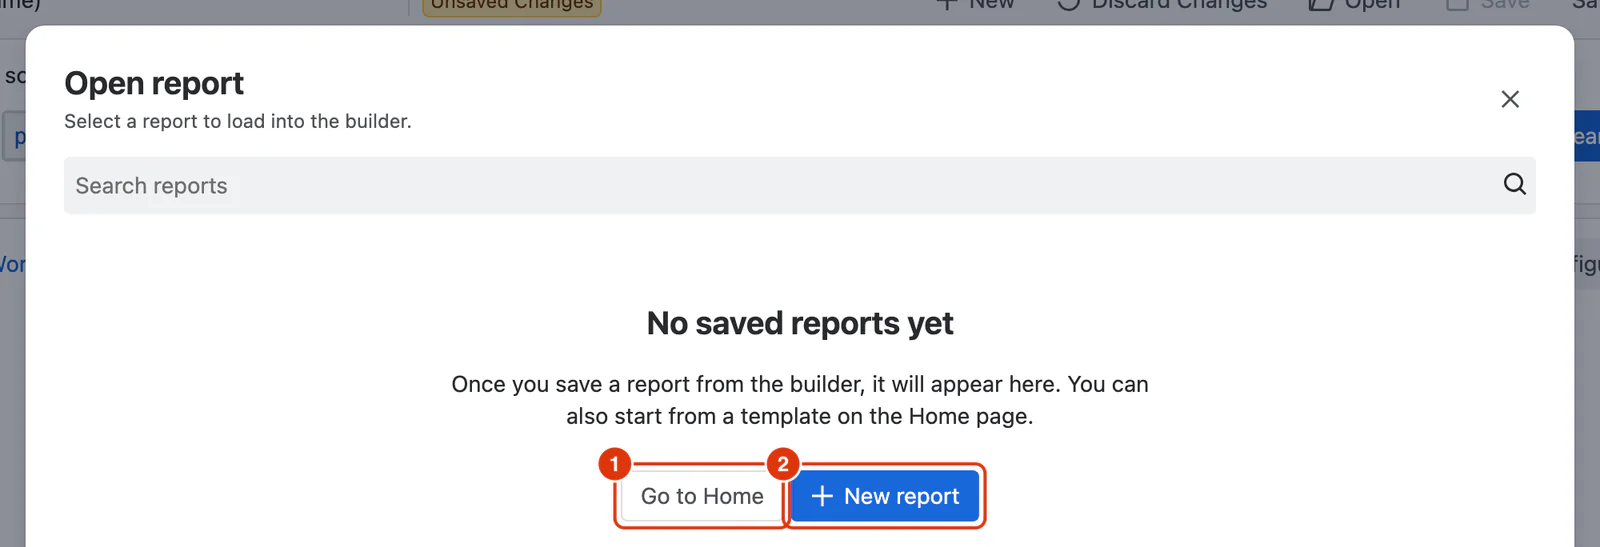
If no reports have been saved yet, the dialog shows an empty state instead: Go to Home (1) for the templates, or New report (2) to start from a blank report.
Starting Over
- Click New (1) to clear the builder and start a blank report. Saved reports are not affected.
- When you change an open report, an Unsaved Changes label appears next to its name. Click Discard Changes (2) to return the report to its last saved version.

For a detailed breakdown of every element in the Report Builder screen, see Report Builder.