
Report Table
The Report Table is the main output area of the Report Builder. It renders below the Data Source section once the report has been configured and at least one dimension is placed in Rows and at least one Metric is added.
Note: The table is one of several view formats. Use the View Format selector in the report toolbar to switch between Table, Bar Chart, Line Chart, and Area Chart. See Report Charts for the chart views.
Empty State
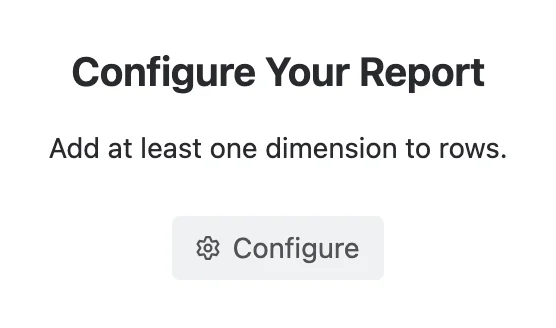
If the minimum requirements are not met — at least one dimension in Rows and at least one Metric — an appropriate message is shown in place of the table. The message names the piece that is missing; click Configure to add it, and the dialog opens on the tab that fixes it.
Filter Chips
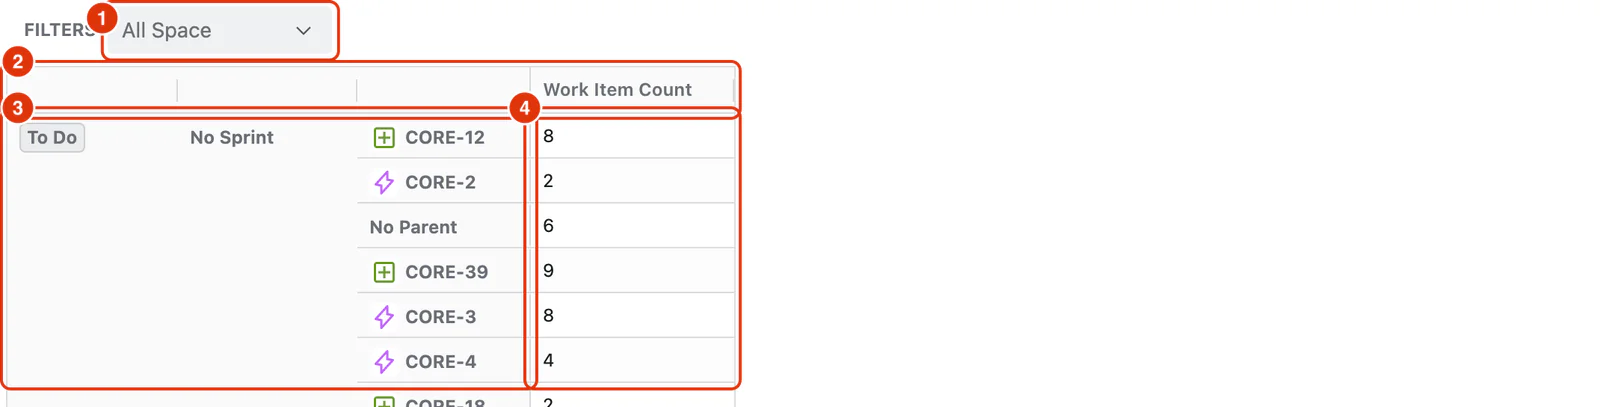
Filter chips (1) appear above the report table for each dimension placed in the Filters zone of the Configure dialog. Each chip shows the dimension name and the currently active filter value.
Click a filter chip to open its dropdown and select one or more values to narrow the report results. Filters affect only the current view — they do not change the saved report configuration.
To add or remove filter chips, go back to Configure and adjust which dimensions are in the Filters zone.
Rows
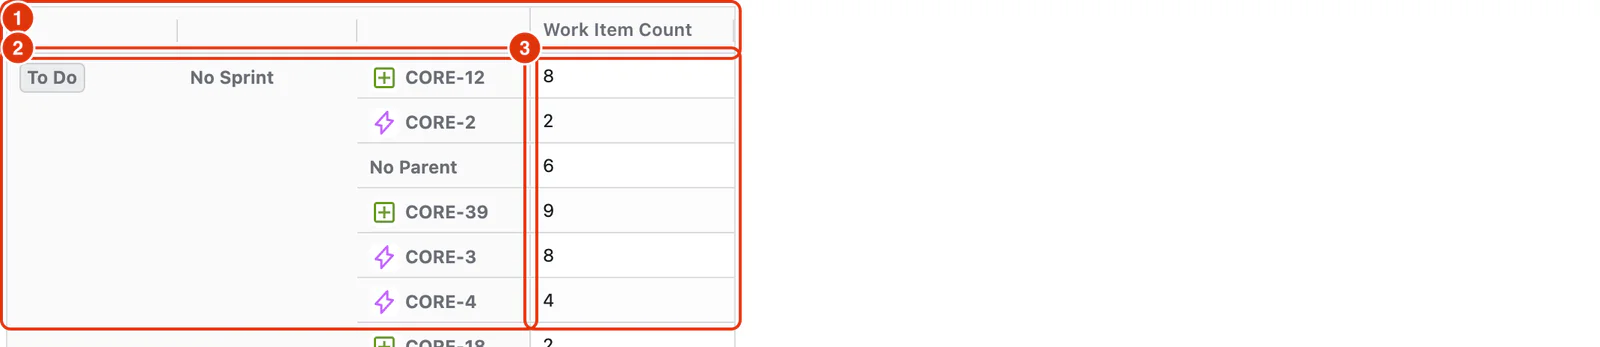
Each unique value of the dimensions placed in Rows appears as a row in the table (2). Row labels stay pinned to the left while the Metric columns scroll. When multiple dimensions are in Rows, their value combinations appear as individual rows side by side.
When a dimension is configured with its summary — All Parents, All Statuses, and so on, named after the dimension (see Categorical Dimension Configuration) — a row appears grouping every value with its aggregated Metric value.
Columns
Metrics always appear in Columns, as the table's column headers (1). Each Metric instance added in the Add Metrics tab becomes a column in the table. When dimensions are also placed in Columns, each dimension value creates a separate group of Metric columns.
Metric Values
Each cell in the table (3) shows the Metric value calculated at the intersection of the Row value and the Column value. If there is no data for a particular combination, the cell shows an empty value or zero depending on the Metric type.
For a step-by-step guide to building and reading reports, see Building Reports in the Feature Guides section.