
Report Builder
The Report Builder is the central workspace in Dashlytics where you create, configure, and manage reports. To open it, go to Apps → Dashlytics in the Jira left sidebar, then click Report Builder in the Dashlytics navigation.
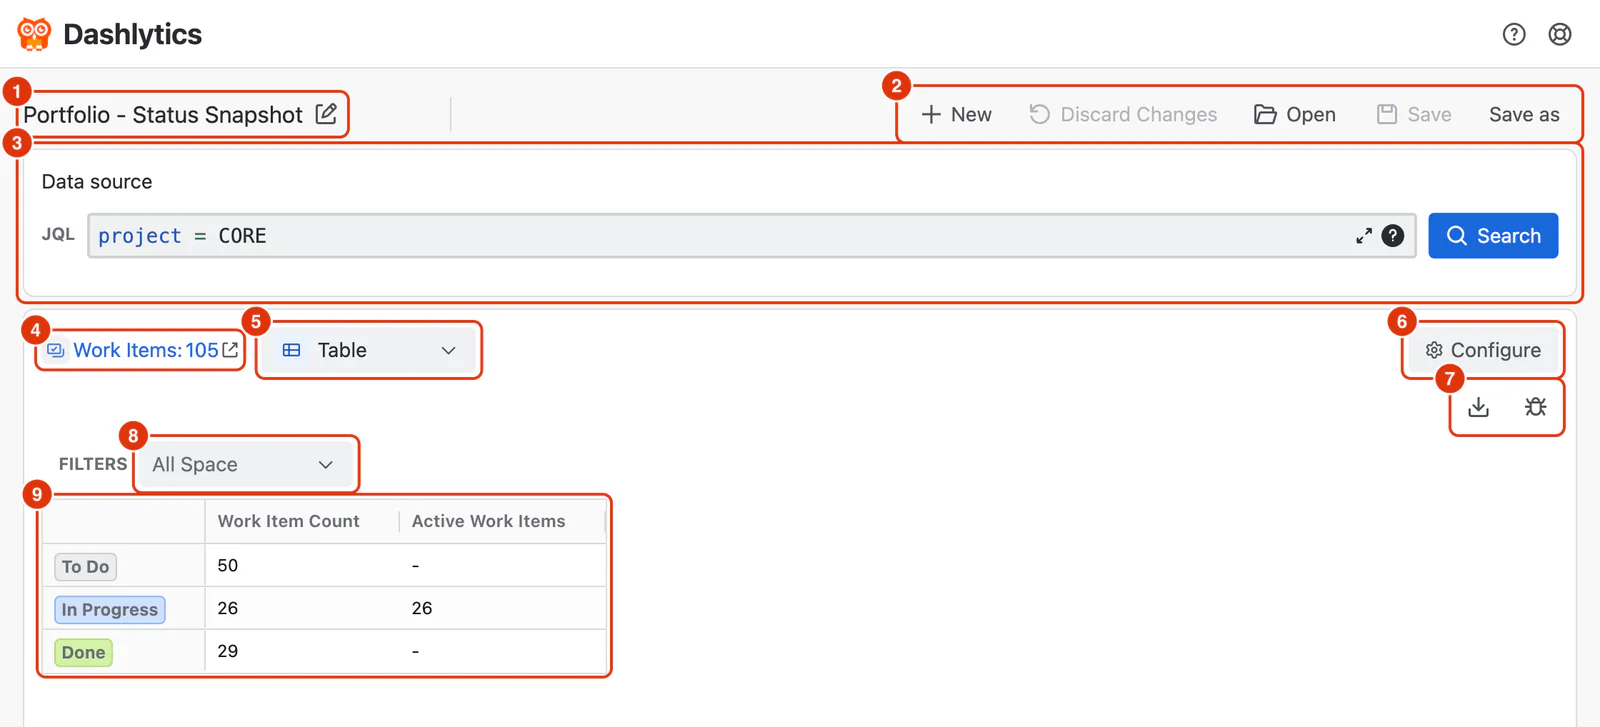
- Report name — the name of the open report, with the Edit Report Details icon beside it. See Report Name below.
- Toolbar — New, Discard Changes, Open, Save and Save as. See Report Toolbar.
- Data source — the JQL query the report is built from, and Search. See Data Source.
- Work Items count — how many work items the query returned. The external link icon opens them in Jira.
- View format — renders the report as a Table, Bar Chart, Line Chart or Area Chart, saved with the report. See Report Charts.
- Configure — opens the Configure report dialog, where dimensions and Metrics are set. See Configure Report.
- Export and debug — see Export and debug actions below.
- Filters — one filter per dimension placed in the Filters zone of the Configure dialog.
- Report — the rendered table or chart. See Report Table.
The report renders once at least one dimension is placed in Rows and at least one Metric is added. Until then, a message is shown in its place.
Report Name
Click the Edit Report Details icon (1) next to the name to open the Report Details popup, where you can update the name and description (2) and see who created the report and when it was last updated (3).
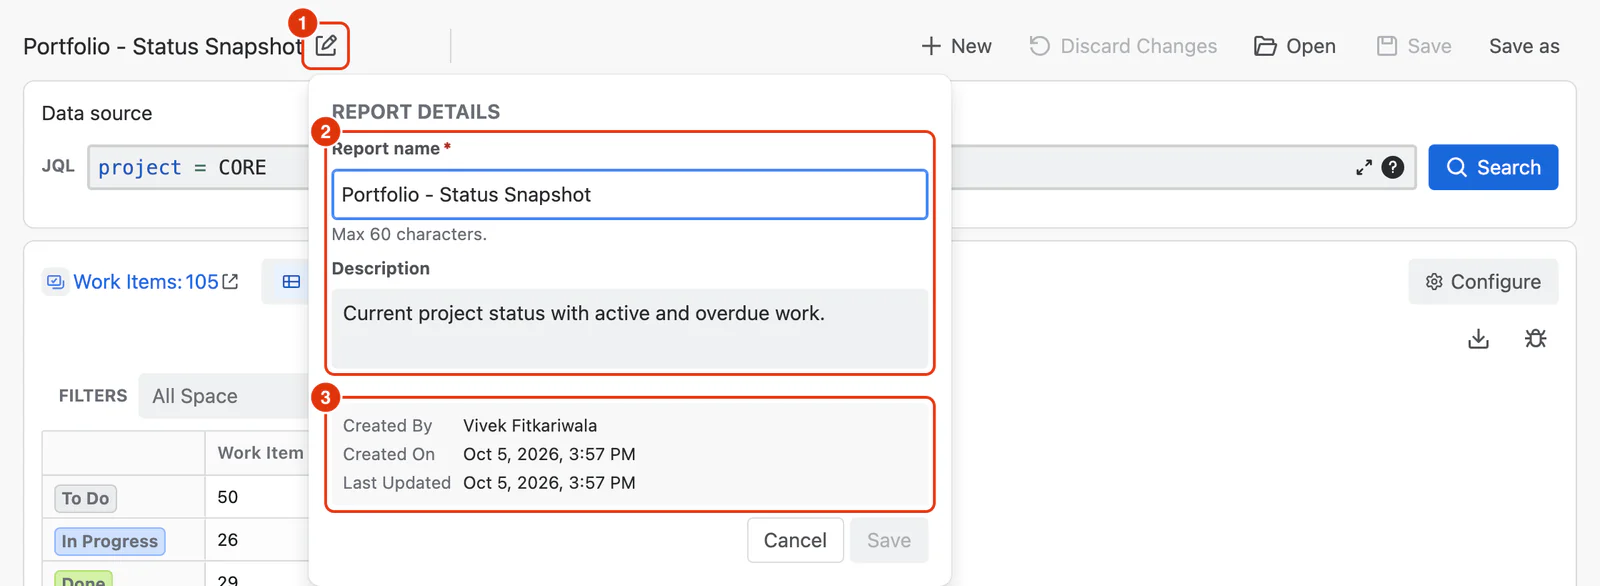
Report name (required) — the name of the report. Must be unique. Maximum 60 characters.
Description (optional) — a brief description of what the report shows and who it is for. Displayed as a tooltip on the report card on the Home screen.
Created by, Created on, and Last updated show the report's ownership and history.
Export and debug actions
The two icons above the report filters apply to the report as it is currently displayed.
Export — the download icon. Downloads the current report as CSV, Excel, or PDF. It stays greyed out until the report has data to export. See Exporting Reports for format details and limitations.
Download debug data — the bug icon. Downloads a diagnostic ZIP to help Dashlytics Support investigate a report problem. See Downloading Debug Information for privacy and secure-sharing guidance.
For a step-by-step guide to building reports, see Building Reports in the Feature Guides section.