
Using the In-App Documentation
This documentation is built into Dashlytics. You can open it in a panel beside the page you are working on, so you can read about a screen, a Metric, or a setting without leaving it.
Open the Documentation
There are three ways to open the documentation:
- Documentation — the question mark icon at the top right of every Dashlytics page, next to Support. It opens the documentation for the page you are on: the Report Builder, the Home screen, or the Administration pages.
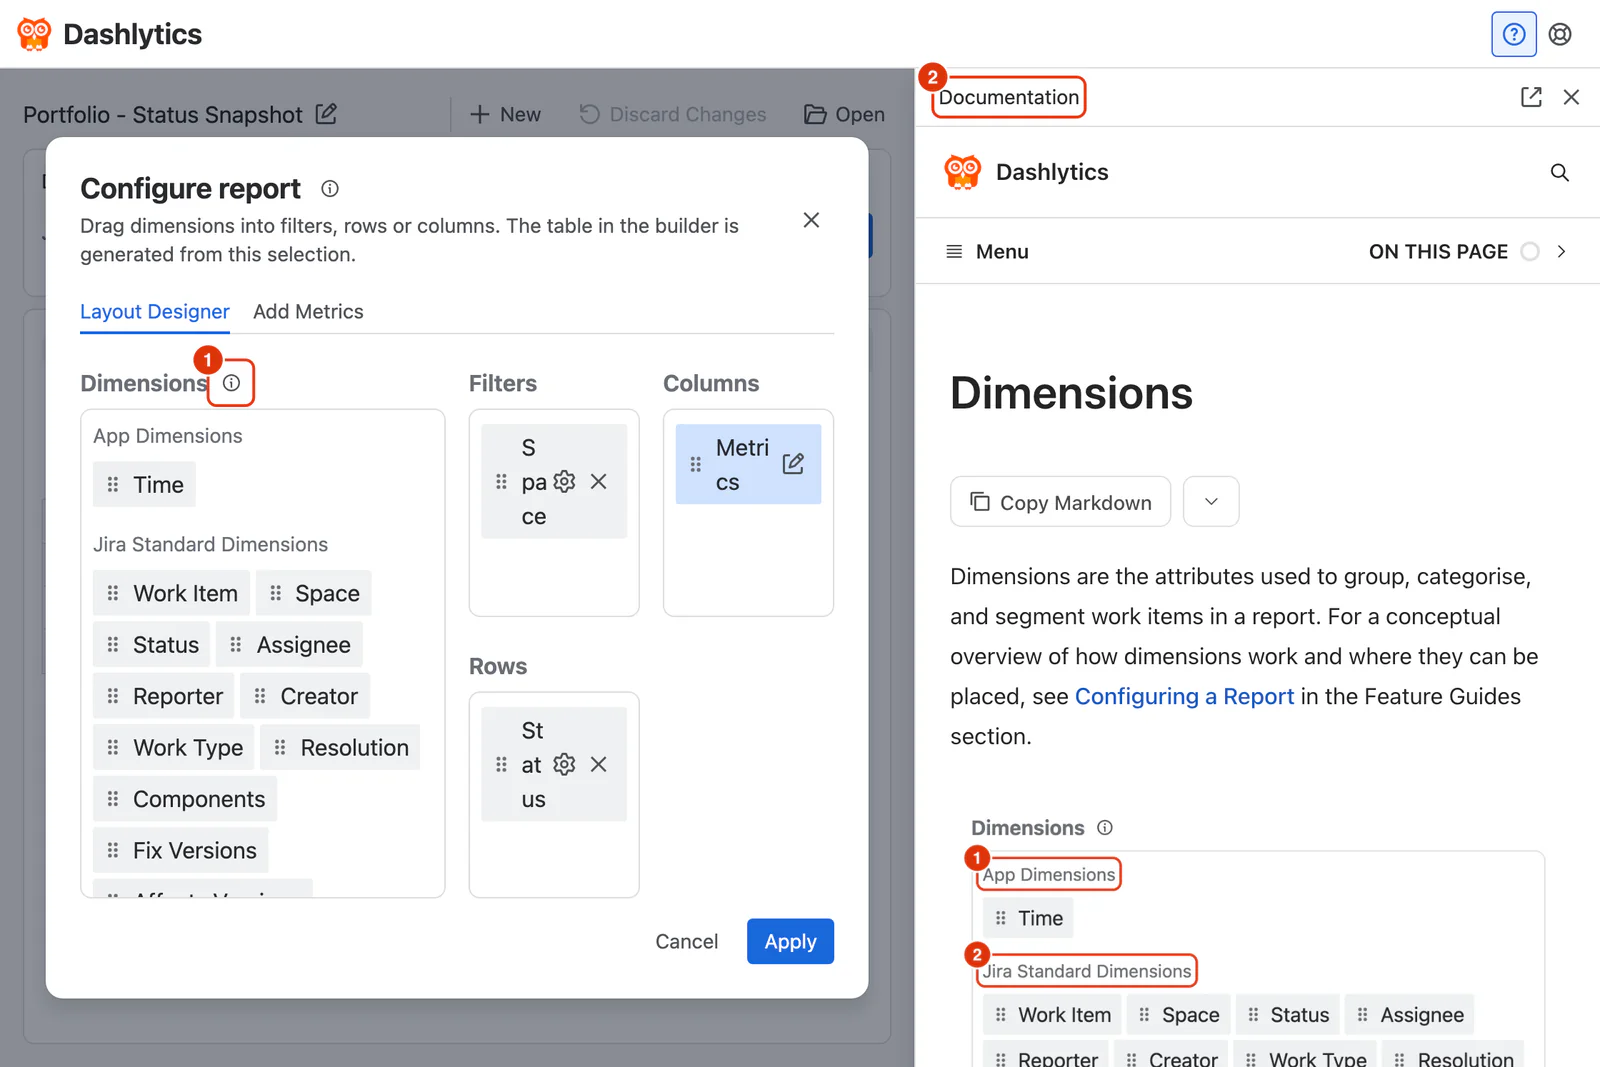
- Information icons — the small ⓘ icon next to a heading, section, or Metric. It opens the page that describes that item. You will find these icons in the Configure dialog, next to each Metric and dimension, and on the App Settings and Work Calendars pages.
- View documentation — the link in a template's tooltip on the Home screen. It opens the documentation for templates.
The Documentation Panel
On the Home screen, the Report Builder, and the Administration pages, the documentation opens in a panel on the right of the page. The panel contains the full documentation site, including the sidebar, the table of contents, search, and links to the previous and next pages.
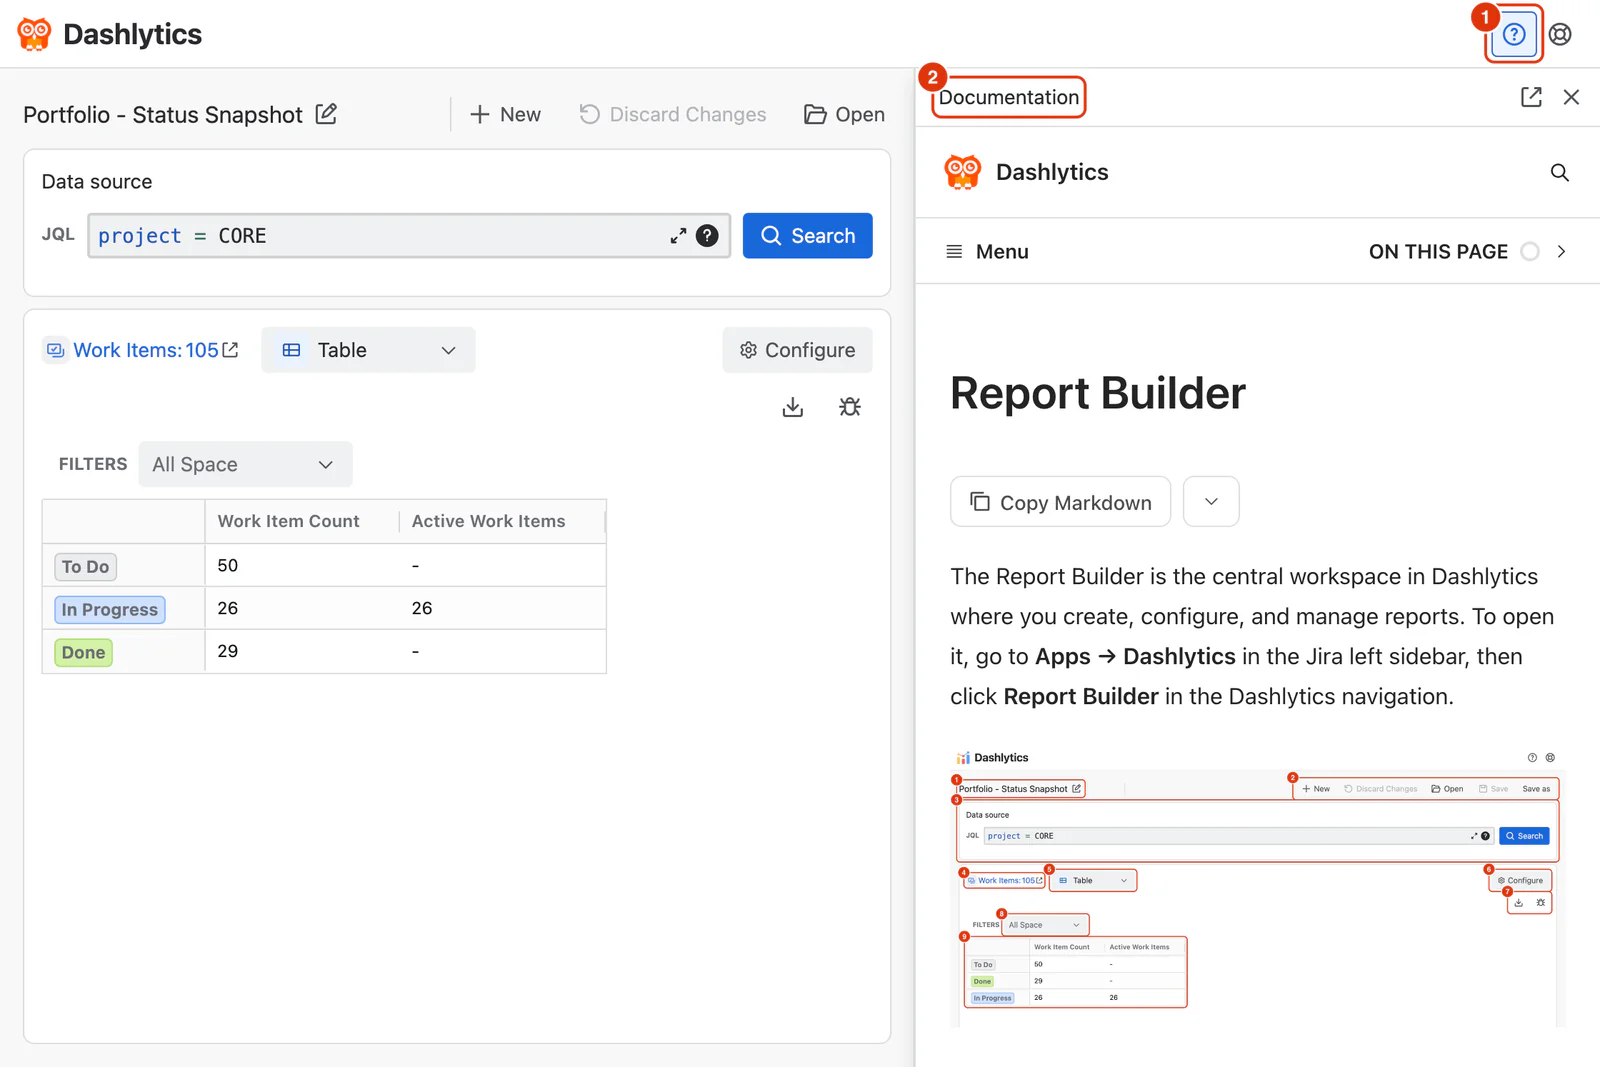
- Resize — drag the panel's left edge to make it wider or narrower. It opens at 480 pixels wide and can be made as narrow as 400 pixels or as wide as half the window.
- Open in a new tab — click the external link icon in the panel's header to open the documentation website in a new browser tab, at the page the panel was opened to.
- Close — click the ✕ in the panel's header, click Documentation again, or press Esc. Esc closes the panel from the Dashlytics page, not while you are clicked into the documentation itself.
On wide screens, the page narrows to make room for the panel, and you can work on both at once. On smaller screens, the panel sits over the right-hand side of the page.
Dialogs open beside the panel rather than over it. For example, you can keep the Configure dialog open while you read about the Metric you are adding, and click the information icons inside it to change the page shown.
Where the Documentation Opens in a New Tab
The Dashlytics gadgets on Jira dashboards and the Get Started page have no panel. There, the Documentation button and the information icons open the documentation website in a new browser tab.
If the Documentation Does Not Load
If the documentation cannot be shown in the panel, the panel shows Documentation unavailable after 15 seconds. Click Open documentation to read the same page on the documentation website instead.
For help with a problem the documentation does not answer, use Support at the top right of any Dashlytics page.