
Configuring a Report
The Configure report dialog is opened by clicking the Configure button in the Report Builder. It has two tabs — Layout Designer and Add Metrics — and closes with Apply, which immediately updates the report.
A report requires at least one dimension in Rows and at least one Metric before it will render. Until both conditions are met, the report area shows an appropriate message.
Layout Designer Tab
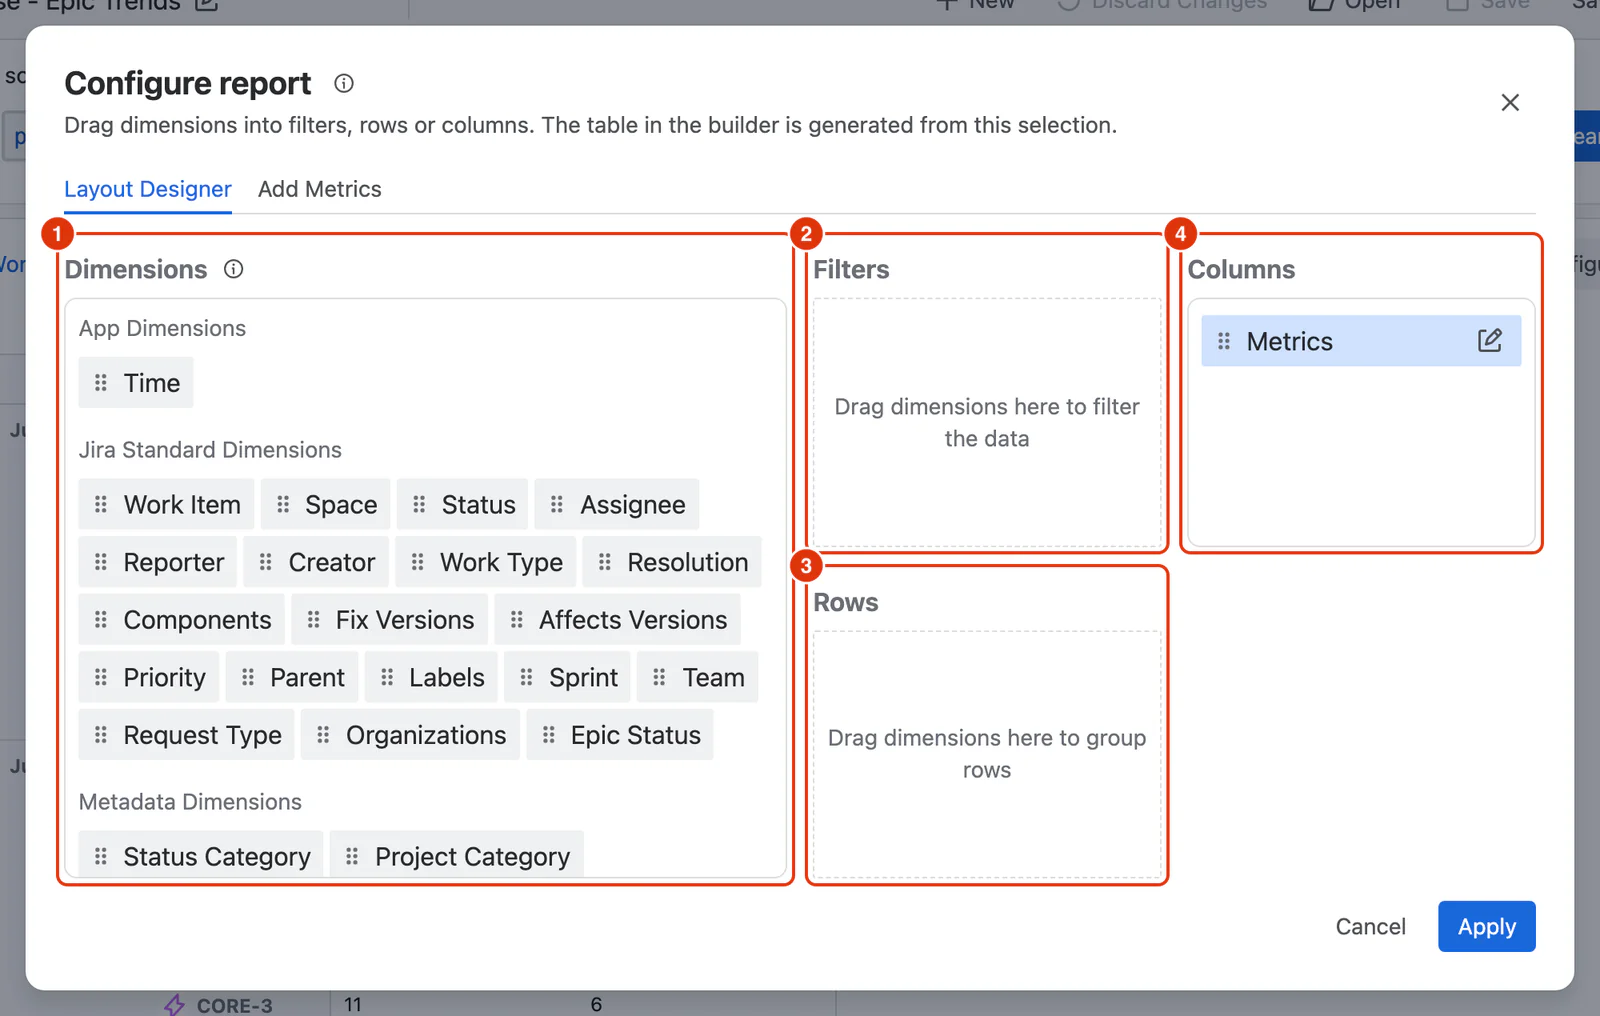
The Layout Designer has three zones where you place dimensions: Filters (2), Rows (3) and Columns (4), filled from the Dimensions list (1).
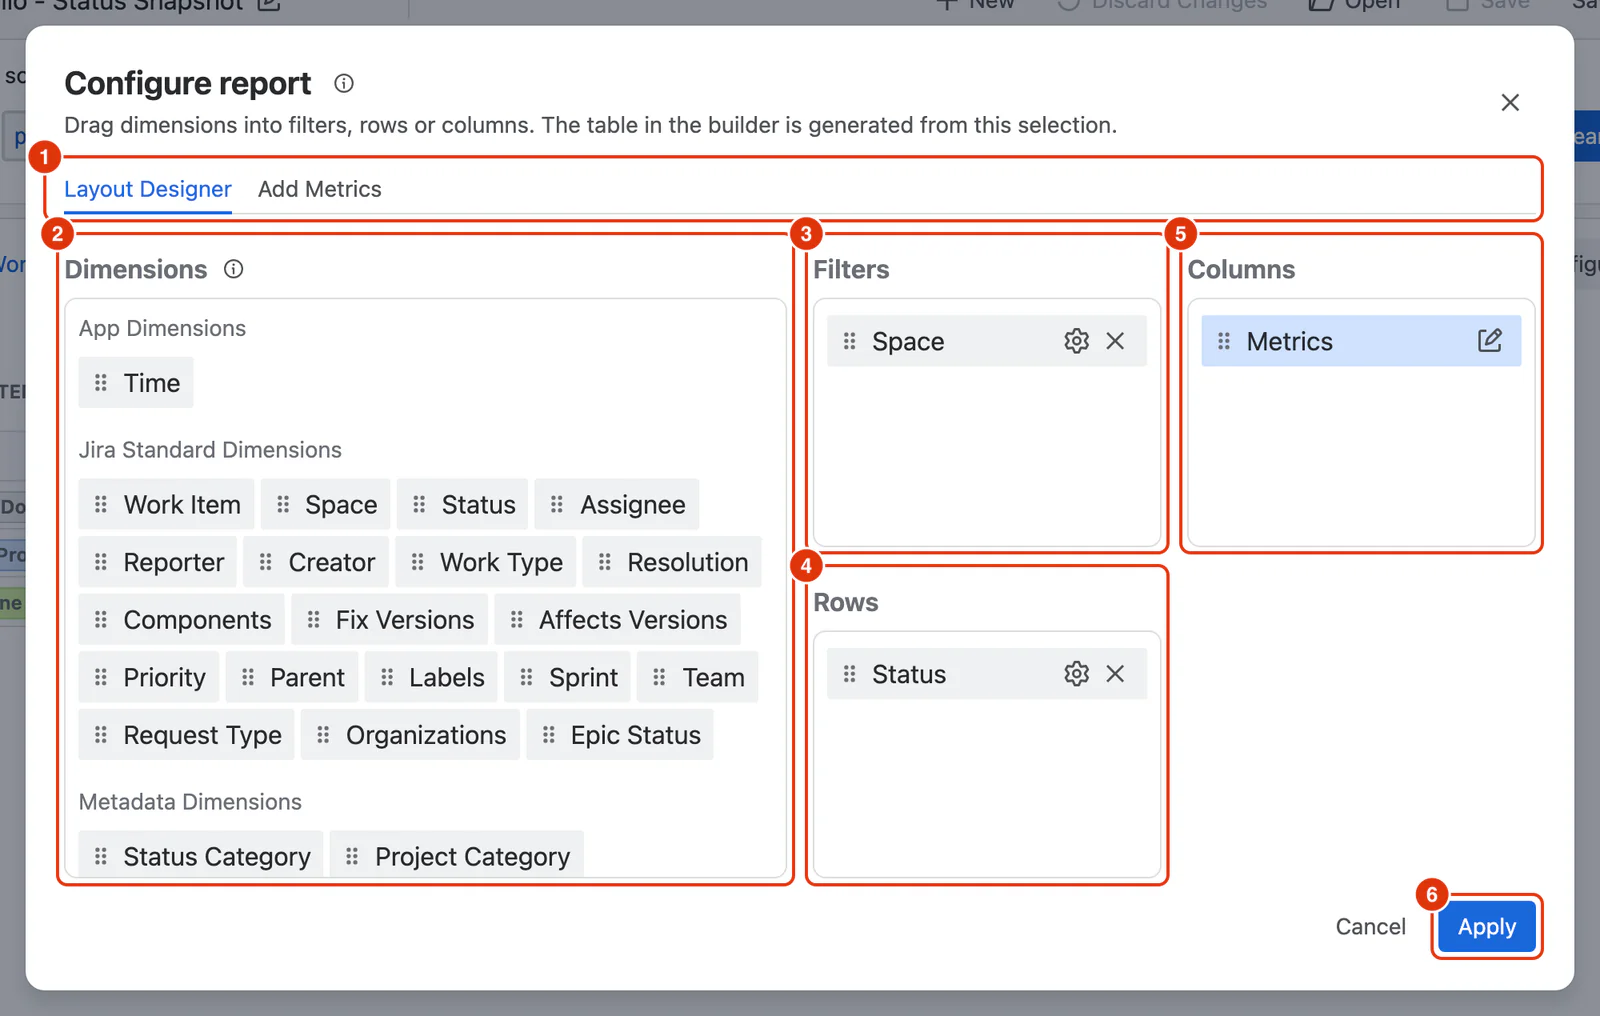
With dimensions placed, each zone shows them as chips, and the report is built from them:
Dimensions panel
The full list of available dimensions. Drag any dimension from this panel into Filters, Rows, or Columns. You can also drag a dimension directly from one zone to another to reposition it without removing and re-adding it.
Once placed in a zone, each dimension can be:
- Configured — adjust how values are grouped, summarised, or displayed.
- Removed — remove it from the zone by clicking the ✕ icon.
- Reordered — drag it to a different position within the same zone.
For a full list of available dimensions and their properties, see Dimensions.
Filters
Dimensions placed here act as report-level filters. Each dimension added to Filters becomes a dropdown selector above the report table, from which users can pick one or more values to narrow results without changing the report structure.
Rows
Dimensions placed here define how data is grouped in the report. Each unique value of the dimension becomes a row. You can place multiple dimensions in Rows — the report will show the combination of their values either as nested rows (expandable) or sibling rows (always visible), depending on each dimension's configuration.
Columns
The Columns zone always contains the Metrics block, which represents all selected Metrics as columns in the report. Dimensions can also be placed in Columns — when a dimension is in Columns, the report creates separate columns for each combination of that dimension's values and each Metric. The Metrics block can be reordered relative to other column dimensions by dragging.
Each Metric is calculated at the intersection of the Row values and Column values. If you have Assignee in Rows, Sprint in Columns, and a Work Items Completed Metric, you get one cell per Assignee × Sprint combination showing the completed count.
Dimension Instances Across Zones
A dimension can be placed in multiple zones simultaneously. For example, Project can appear in both Filters and Rows at the same time.
However, the rules differ by zone:
- Rows and Columns — each dimension can only appear once across both zones combined. You cannot have the same dimension in both Rows and Columns simultaneously.
- Filters — a dimension can appear in Filters even if it is already placed in Rows or Columns, giving you an independent instance.
When a dimension appears in more than one zone, all instances share the same configuration. Changing the configuration of a dimension in one zone will apply to its instance in the other zone as well.
Add Metrics Tab
The Add Metrics tab is where you choose what the report measures.
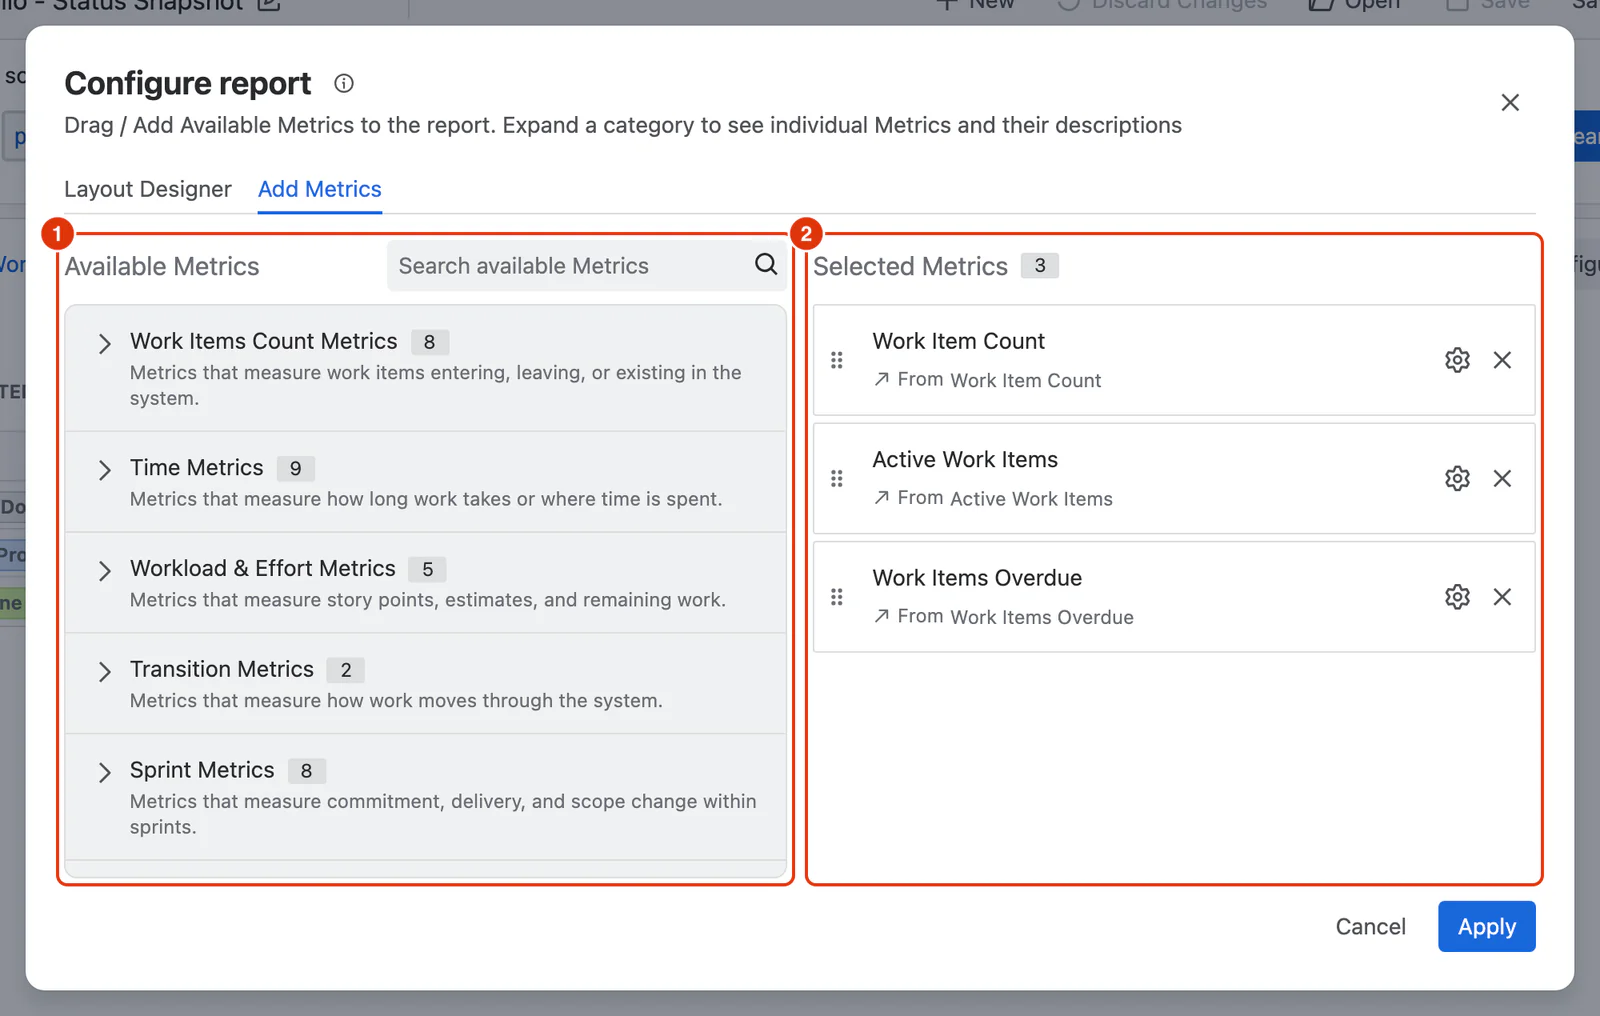
Available Metrics
Metrics are organised into categories (e.g. Work Items Count Metrics, Sprint Metrics, Time Metrics). Expand a category to see individual Metrics with their descriptions. Use the Search Metrics field to find a specific Metric quickly. Click + Add to add a Metric to the report.
For a full overview of Metric types and categories, see Metrics.
Selected Metrics
Shows all Metrics currently added to the report. Each entry shows the Metric name, its description, and the category it came from. From here you can:
- Configure a Metric instance (⚙ icon) — adjust its options such as filters, aggregation, or calendar.
- Remove a Metric (✕ icon) — removes it from the report without deleting the Metric definition.
- Reorder Metrics by dragging them into a different position.
Adding the same Metric multiple times
A Metric can be added more than once, each instance with a different configuration. For example, you could add Work Items Created twice — once for all projects and once filtered to high priority only — to compare them side by side in the same report.
For a detailed breakdown of every option in the Configure dialog, see Configure Report pages in the Dashlytics UI Guide.