
Report Charts
The Report Charts view renders your configured report as a visual chart instead of a table. Charts are built from the same Rows and Metrics you set up in the Configure dialog — each Row value becomes a category along the horizontal axis, and each Metric becomes a series.
View Format
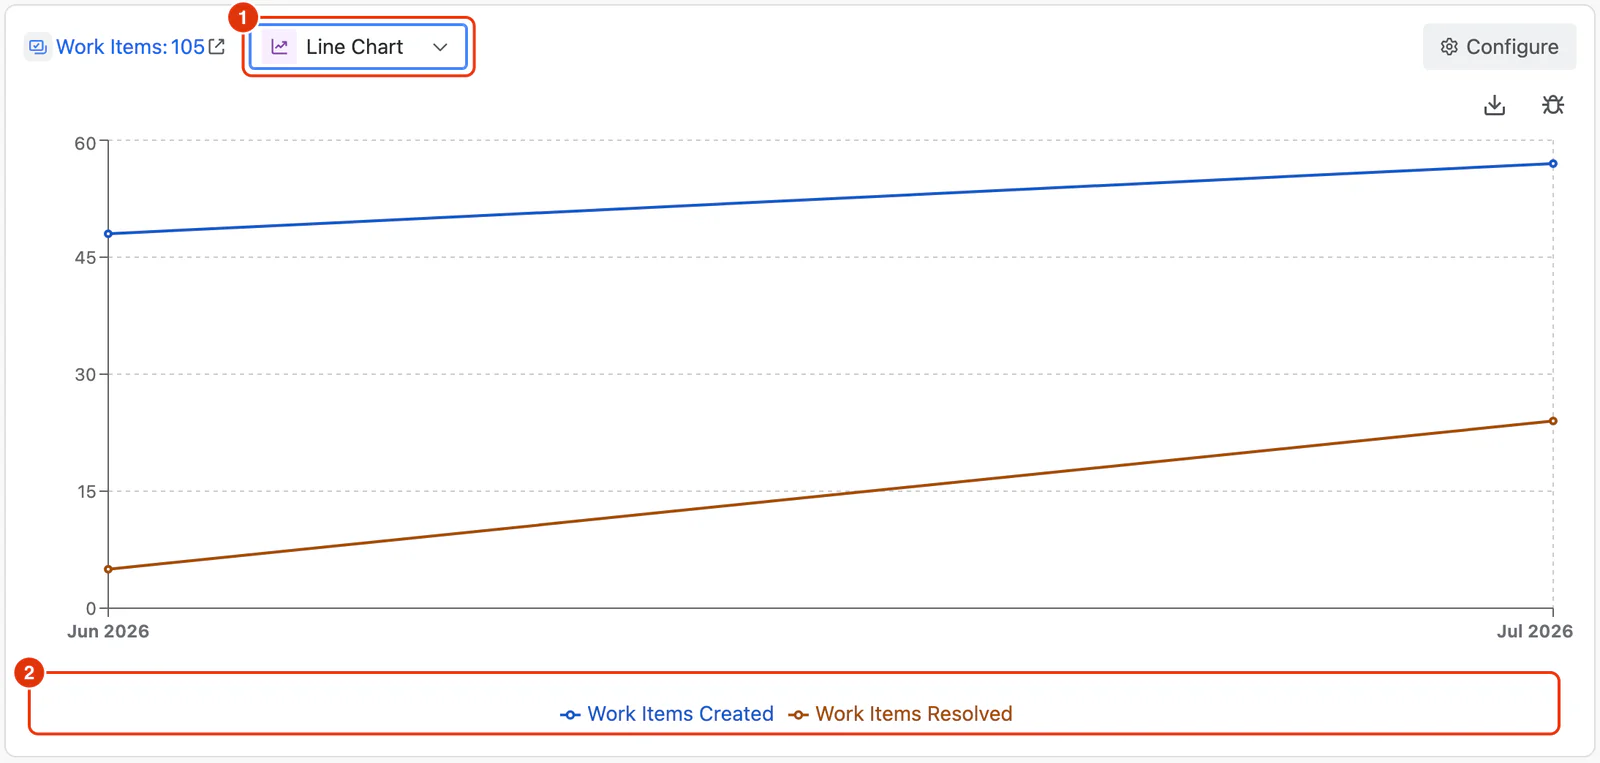
The View Format selector (1) sits in the toolbar above the report, next to the Work Items count and the Configure button. Use it to switch how the report is rendered:
- Table — the default tabular view. See Report Table.
- Bar Chart — Metric values shown as vertical bars.
- Line Chart — Metric values shown as connected lines.
- Area Chart — Metric values shown as filled areas beneath the line.
The selected view format is saved with the report, so the report reopens in the same view — both in the Report Builder and in the Dashlytics Statistical Report Gadget.
Bar Chart
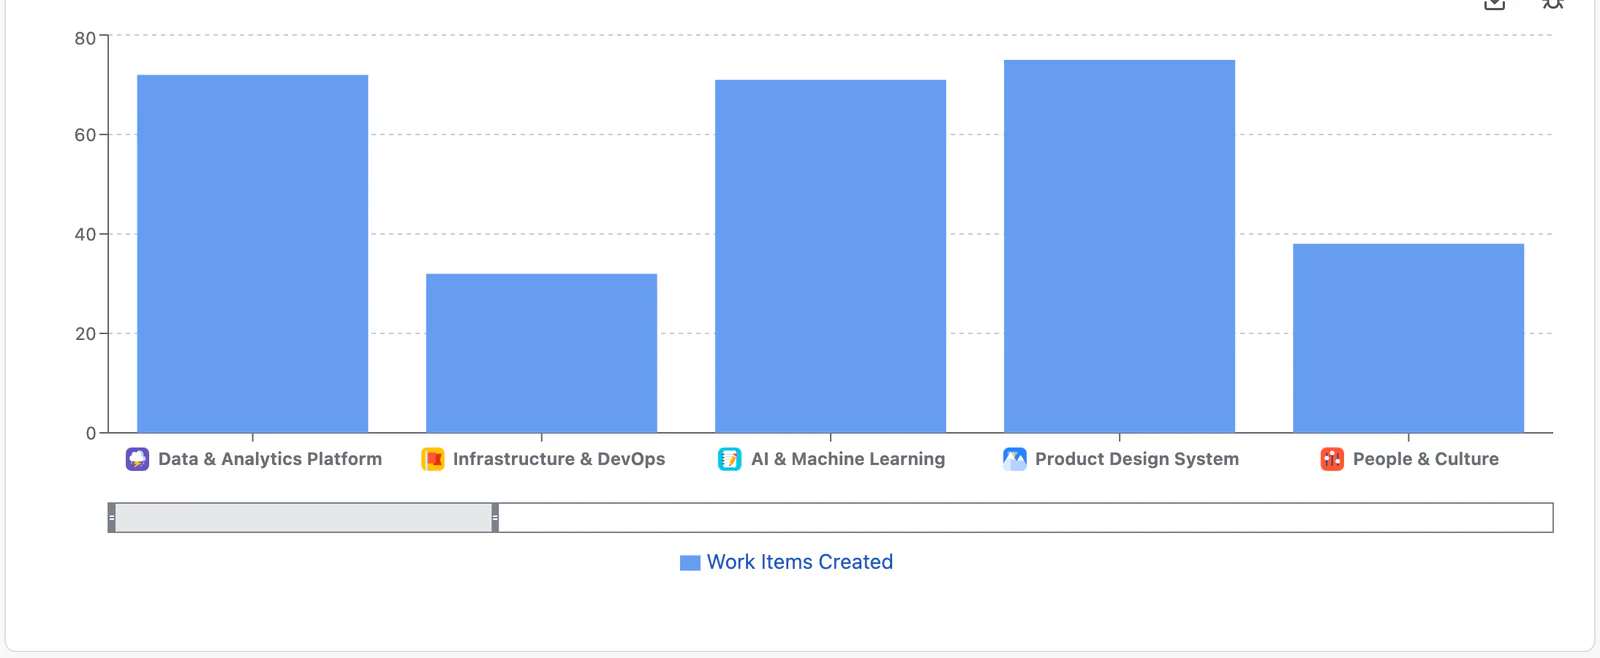
Best for comparing Metric values across discrete categories — for example, work items completed per assignee or per status. Each Row value forms a group along the horizontal axis, with one bar per Metric.
Line Chart
Best for showing trends across an ordered dimension, such as a Time dimension — for example, work items created by month. Each Metric is drawn as a line across the Row values.
The line chart at the top of this page shows the same report drawn this way.
Area Chart
Similar to the Line Chart, but with the area beneath each line filled. Useful for emphasising volume or magnitude over time.
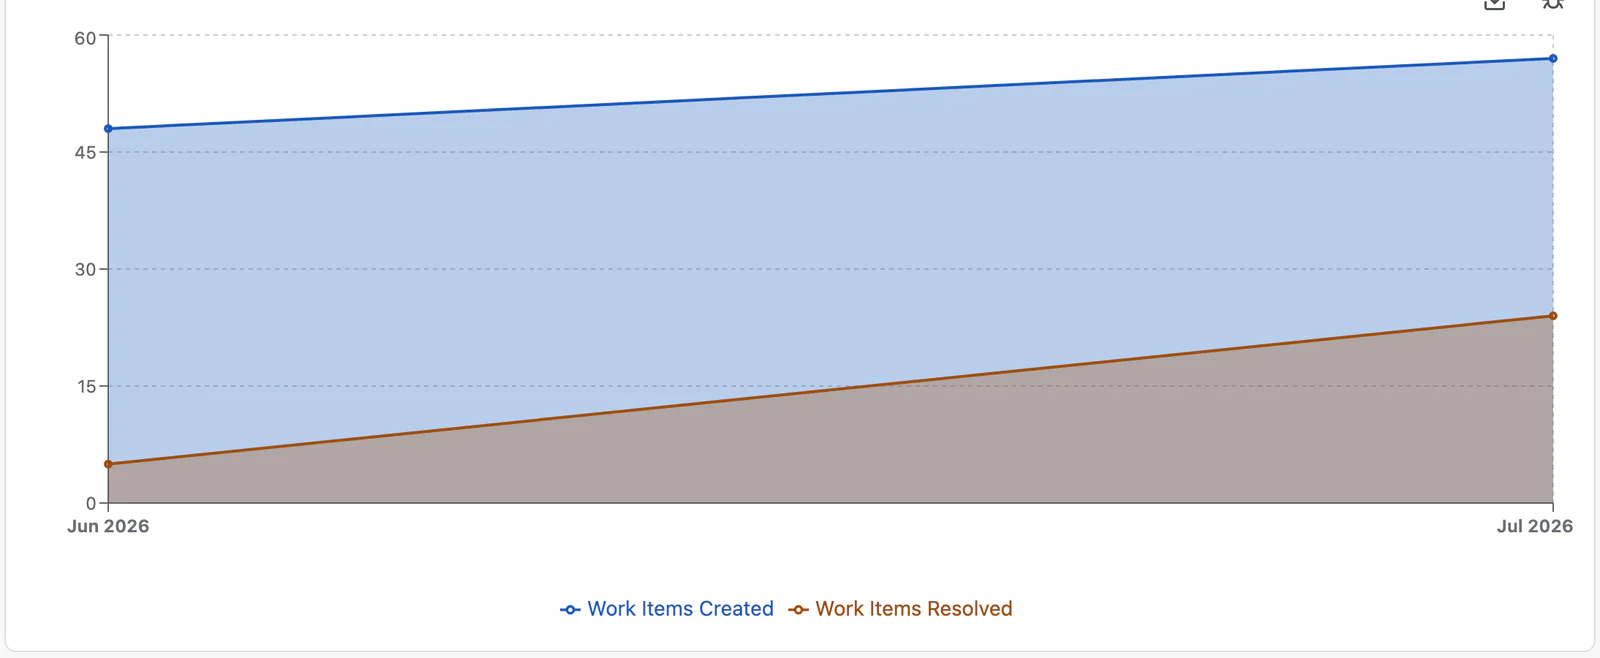
Chart Options
All chart types share the same interactive controls.
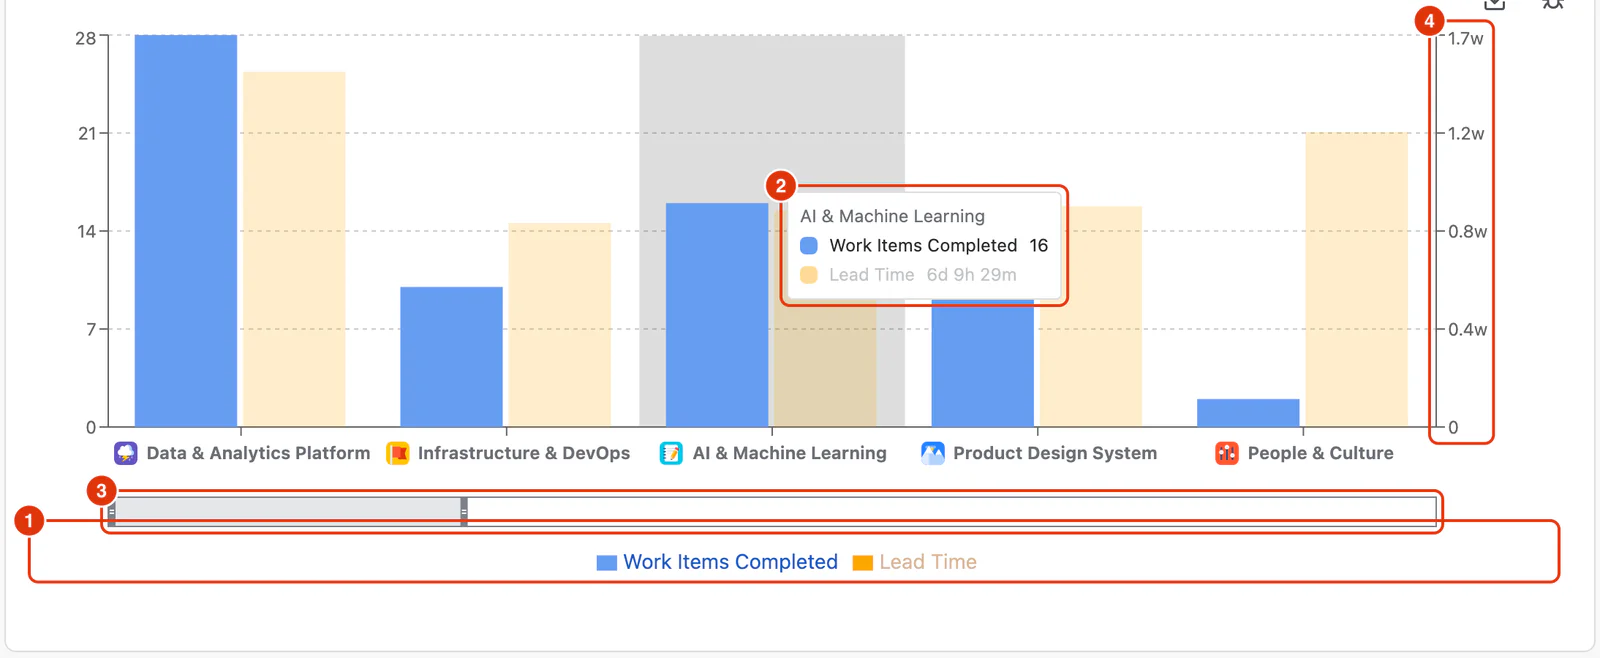
- Legend (1) — each Metric appears as a series in the legend below the chart. Click a series to hide or show it; hovering highlights that series.
- Tooltip (2) — hover over any bar, point, or area to see the exact values for that Row.
- Scroll (3) — when a report has many Row values, a scroll control appears beneath the chart so you can pan across the data without it becoming cramped.
- Dual axes (4) — when a report mixes count-based Metrics and duration-based Metrics, the chart shows two vertical axes: counts on the left and durations (formatted as weeks, days, hours, and minutes) on the right. The chart above pairs Work Items Completed with Lead Time, so the left axis counts work items and the right one reads in weeks and days.
For a step-by-step guide to building reports and switching views, see Building Reports in the Feature Guides section.