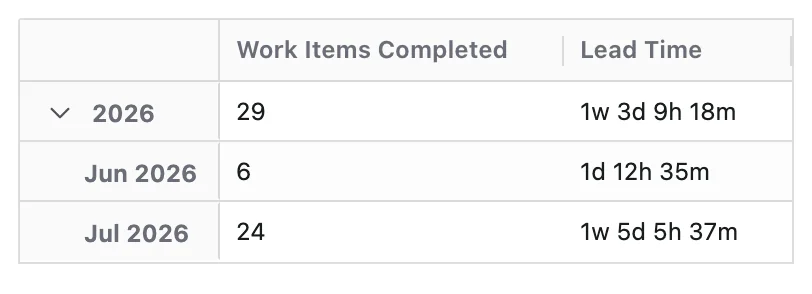
Completed Items and Average Lead Time by Month
This report tracks how many work items the team completes each month alongside the average time it took to deliver them. Together, throughput and lead time reveal whether delivery pace is improving, and whether faster delivery is coming from efficiency gains or simply easier work.
Start a report
- Go to Apps → Dashlytics in the Jira left sidebar, then click Home.
- Click Open Builder, then New in the toolbar, to start from a blank report.
- In the Data Source section, enter a JQL query to scope the work items — for example:
project is not EMPTY. Click Search. - Click the Configure button to open the Configure report dialog.
Lay out the rows
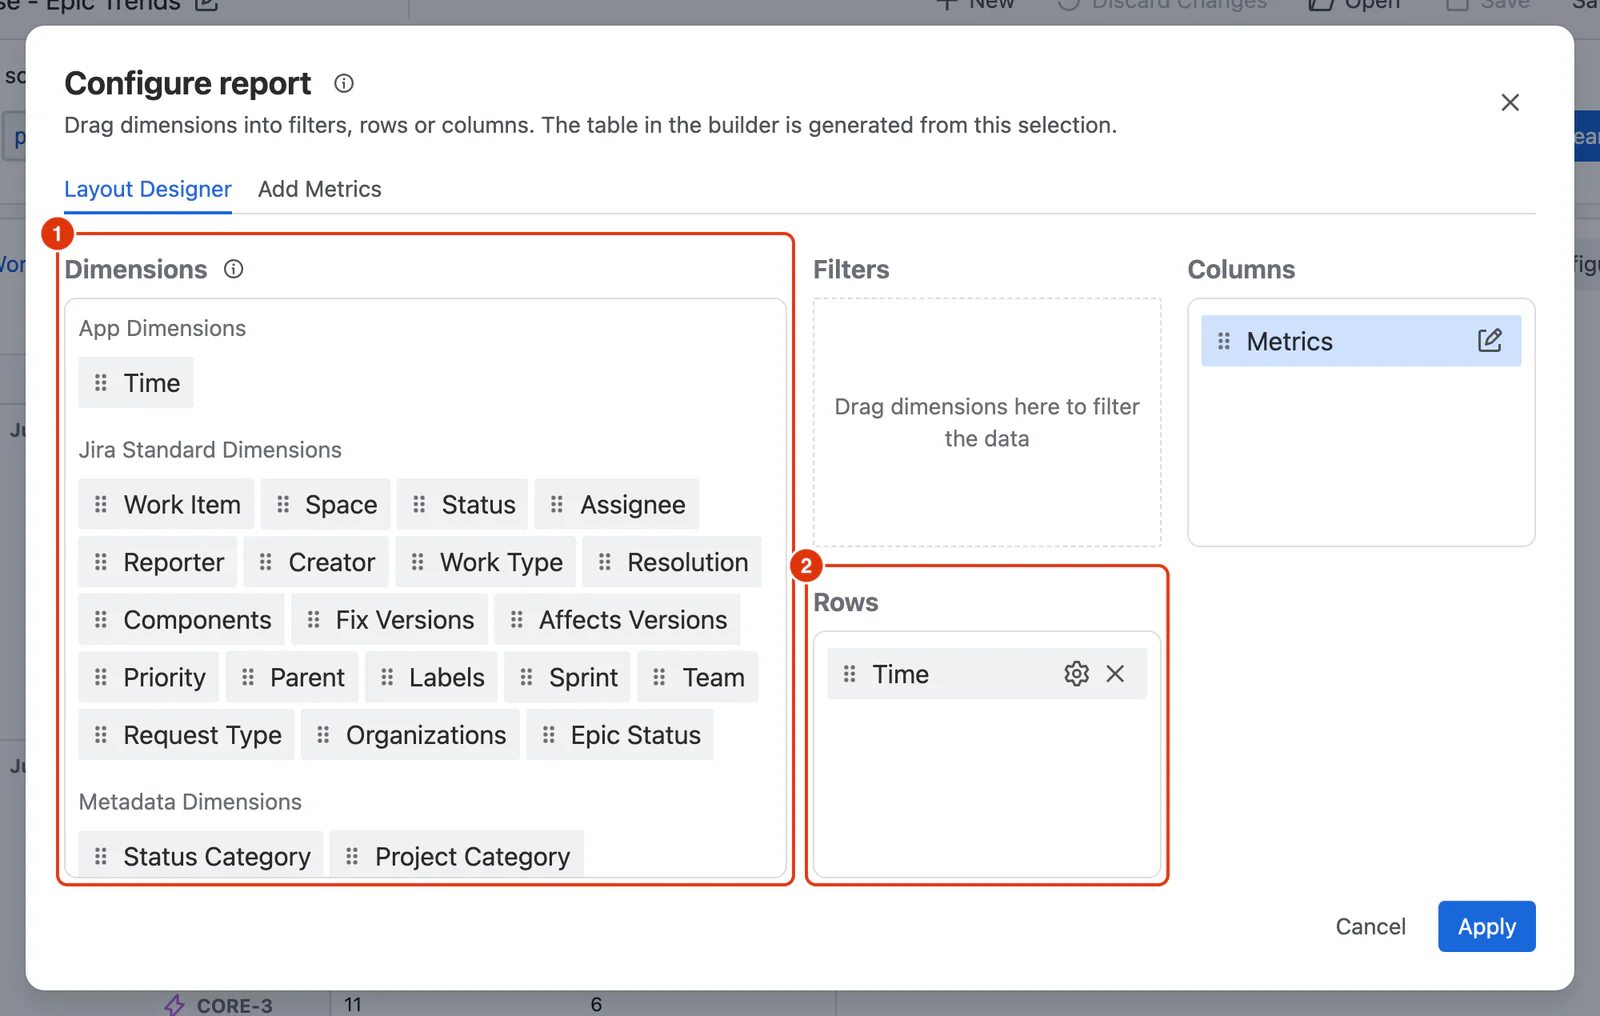
- In the Layout Designer tab, drag Time from the Dimensions list (1) into the Rows zone (2).
- Click the ⚙ icon on the Time chip to open its configuration. Under Time Units, select Month. Click Apply.
- Optionally, drag Space, Assignee or Work Type into the Filters zone below Columns to allow narrowing results later.
Add the two Metrics
- Go to the Add Metrics tab. In Available Metrics (1), expand Work Items Count Metrics and click + Add on Work Items Completed. It appears under Selected Metrics (2).
- Expand Time Metrics and click + Add on Lead Time.
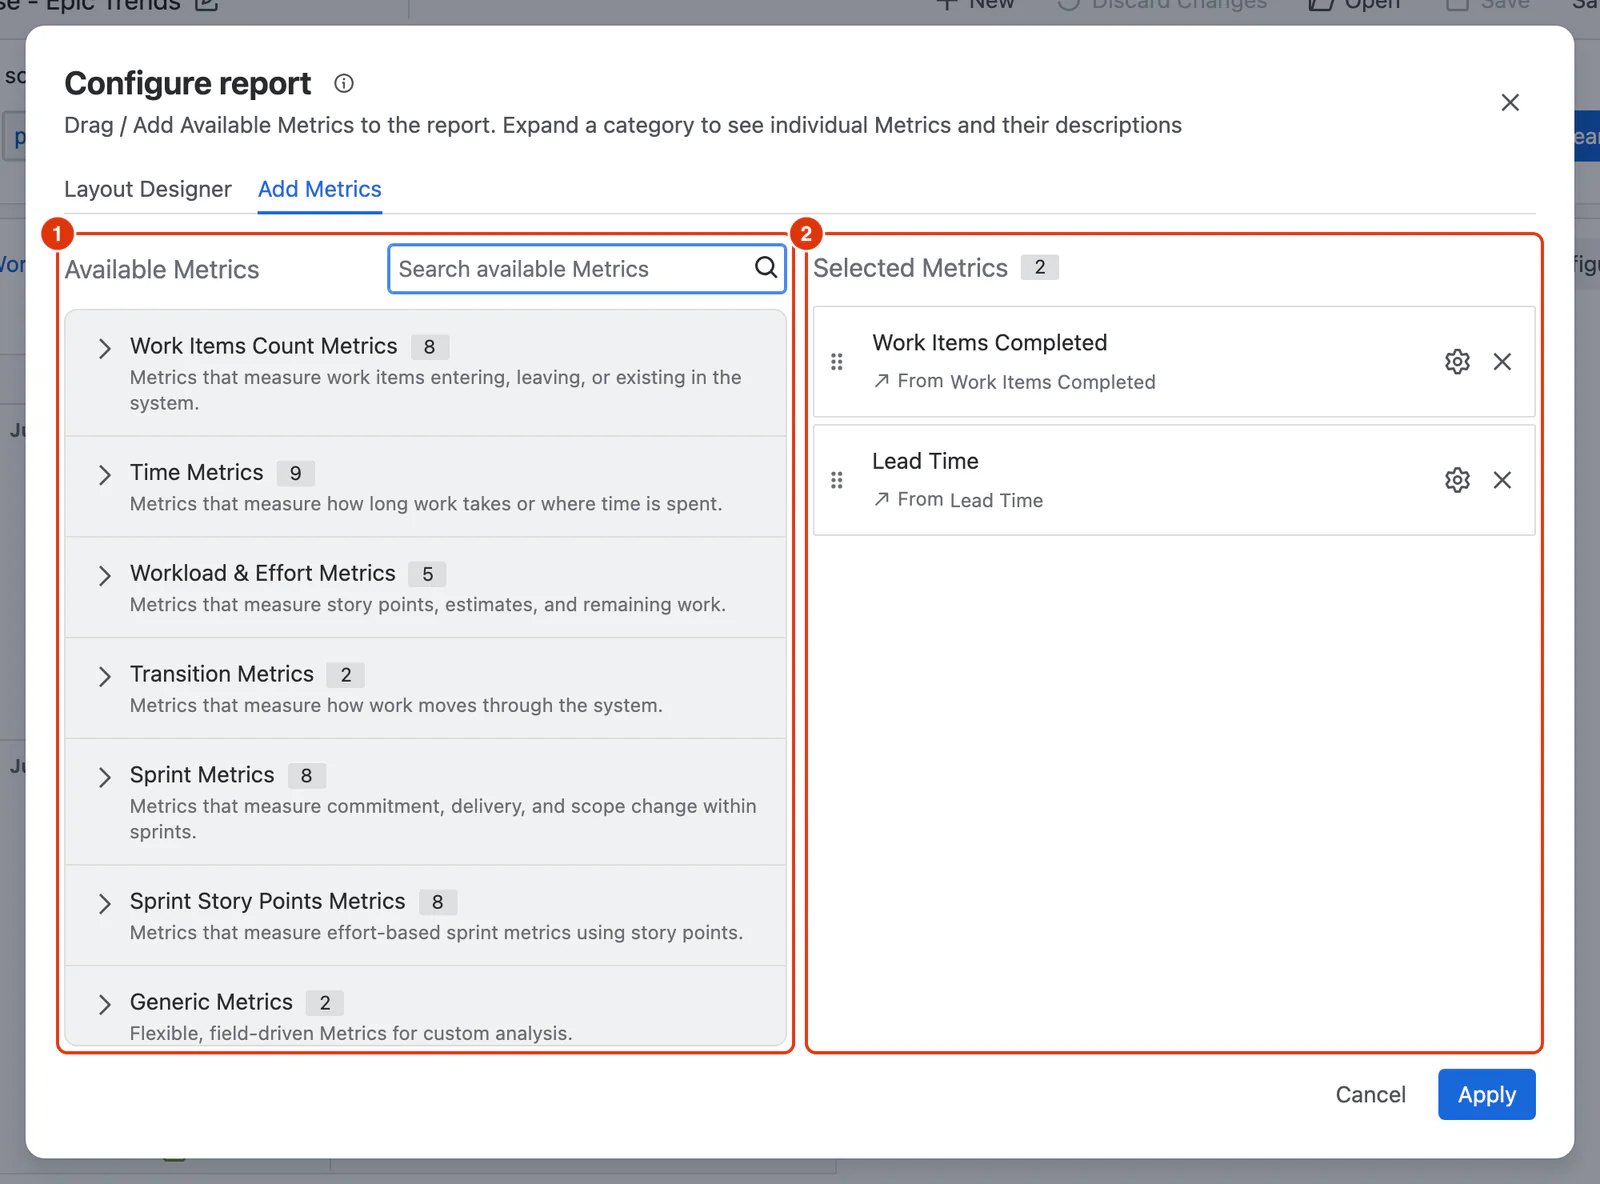
- Click the ⚙ icon on Lead Time to configure it, then click Apply in the panel:
- Name: Avg Lead Time — the screenshots keep the default Metric names.
- Set Aggregation to Average.
- Optionally set a Work Calendar if your team works to one, so non-working days are excluded.
- Click Apply to close the dialog and render the report.
- Use the filter chips above the report table to narrow results by space, assignee or work type.
- Click Save as in the toolbar, enter a report name, and click Save report.
Tip
For every setting on a Metric, see Metric Configuration.
Result
Each year groups the months beneath it. Expand a year to read throughput and average lead time side by side, month by month.